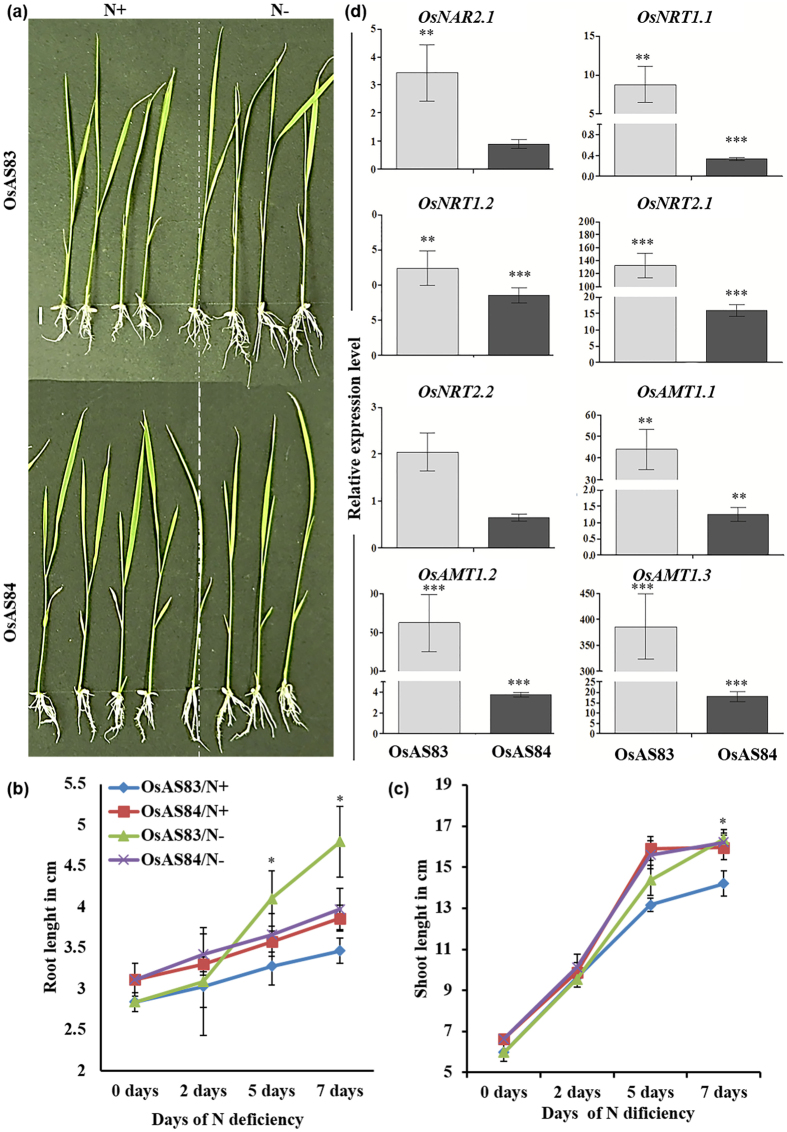
Figure 5. OsAS84 showed less sensitivity towards nitrogen deficiency.
(a) Physiological responses of OsAS83 and OsAS84 to nitrogen deficiency. Scale bar 1 cm. (b,c) Primary root length and shoot length of OsAS83 and OsAS84 in N+ and N− conditions. Error bars represents standard error (n = 10). The experiment was repeated three times with similar results. (d) Expression pattern of OsNRTs and OsAMTs genes in root tissue harvested after 7th day, in both N deficit and normal conditions. Error bars indicate Standard error (n = 3). Asterisks indicate significant statistical differences, ***P < 0.001, **P < 0.01, *P < 0.05 (One-way ANOVA).

