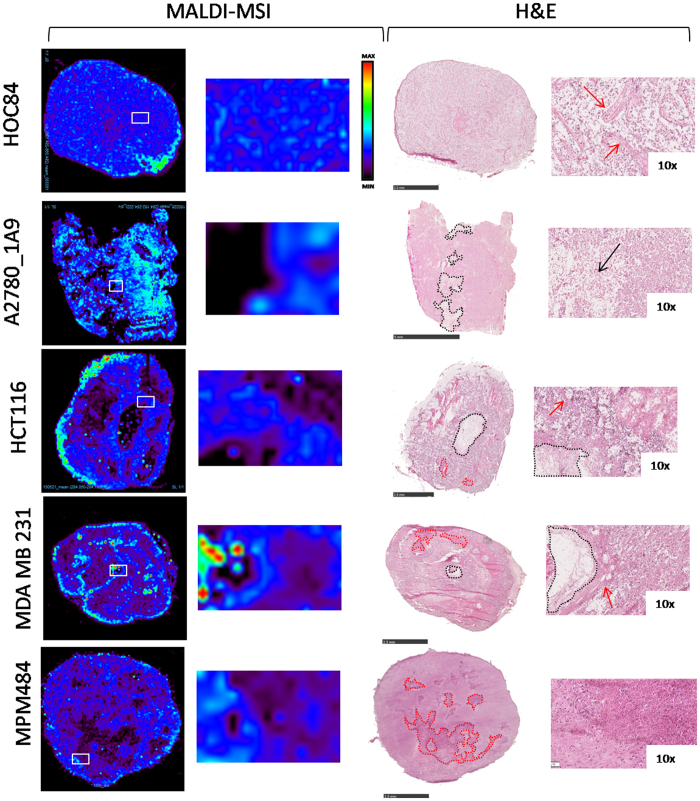
Figure 7. Overlapping of MALDI MSI results and H&E staining.
The white squares in MSI images correspond to the region shown in the enlargement. Black dotted lines and arrows in H&E images indicate necrotic regions. Red dotted lines and arrows indicate fibrotic region. H&E scale bar correspond to 2.5 mm except for A2780-1A9 (5 mm).

