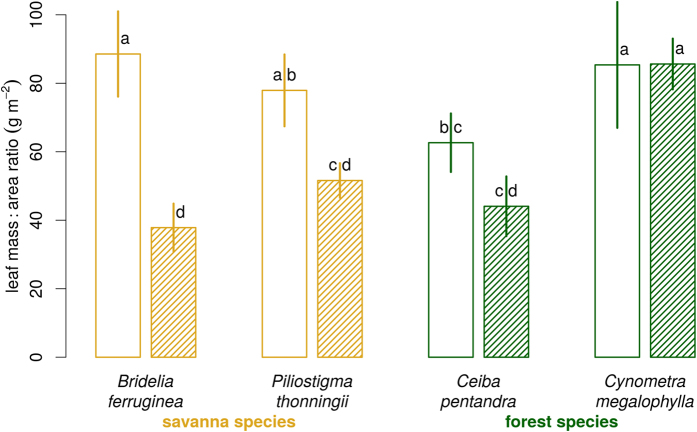
Figure 8. Leaf mass:area ratio LMAL at age 6 months of seedlings grown in the open plot (open bars) or in the shaded plot (hashed bars).
Error bars represent ± 1 standard deviation (n = 5). Bars with the same letter are not significantly different at the 5% level (goupings based on the Tukey multiple comparison test).

