
Fig. 1.
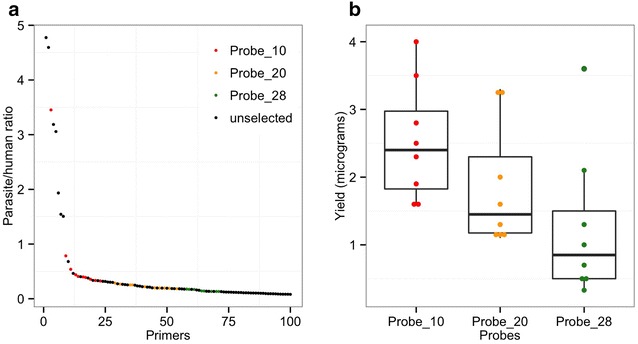
Primer selection analysis. a The frequency of each primer as ranked by the frequency of occurrence. The y-axis represents the calculated ratio of the frequency in the parasite (desired) genome against frequency in the human (contaminating) genome. The x-axis shows the order of ranking by the frequency of occurrence ratio. b DNA yield obtained following the selective whole genome amplification with different pools of probe sets. Probe_10 represent a pool of the first top 10 ranking primers. Probe_20 is a cumulative mixture consisting of all the Probe_10 primers plus the next 10 probes in that order. Probe_28 is a cumulative mixture of all the first 28 primers (Probe_10, Probe_20 and the next 8 probes in the order of frequency ranking)