Figure 2.
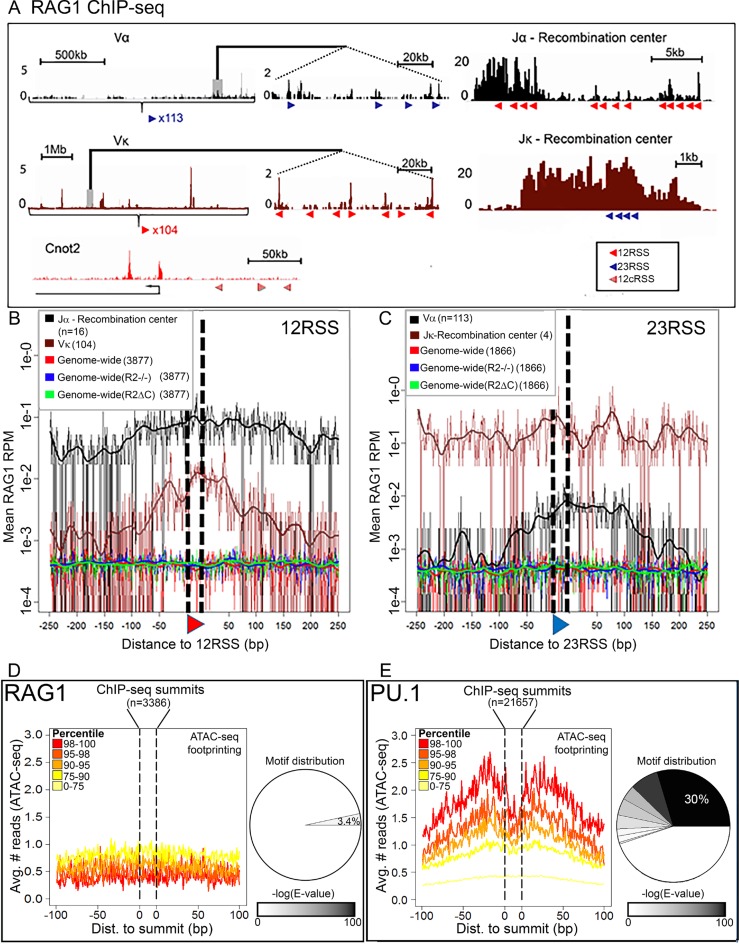
The role of DNA sequence in RAG1 targeting. (A) RAG1 D708A ChIP-seq profiles at RSSs and cryptic RSSs (cRSSs). Top, TCRα locus (black), middle, Igκ locus (brown) and bottom, a non-antigen receptor locus Cnot2 (red). Red and blue triangles, 12 and 23RSSs, respectively; c12RSS, red hatched triangles. Panels in the center show a magnified section of each locus. (B and C) D708A-RAG1 ChIP-seq signal plotted for the 500 bp surrounding RSS/cRSS in the indicated genotypes. (B) 12RSS or 12cRSS or (C) 23 23RSS or 23cRSSs. cRSSs were identified using the RIC algorithm (27) with stringent thresholds of RIC > −28 for 12cRSSs and RIC > −44 for 23cRSSs. All data derive from mouse thymus except for Jκ and Vκ plots, in which the data derive from mouse pre-B cells. (D and E) Footprinting analysis—cut-site probability was taken as the mean ATAC-seq signal for 200 bp surrounding (D) RAG1 or (E) PU.1 ChIP-seq summits. Footprint were analyzed as described in ‘Materials and Methods’ section. Pie charts indicate the distribution of motifs as a fraction of (D) RAG1 and(E) PU.1 summits; 3.4% of RAG1 summits (±10 bp) share a sequence motif (E-value (motif) = 4.1e-4), while 55% of PU.1 summits share at least one motif, with the dominant motif representing 30% of the peaks (E-value (motif) = 2.2e-1291). See Supplementary Figure S1 for motif sequences.

