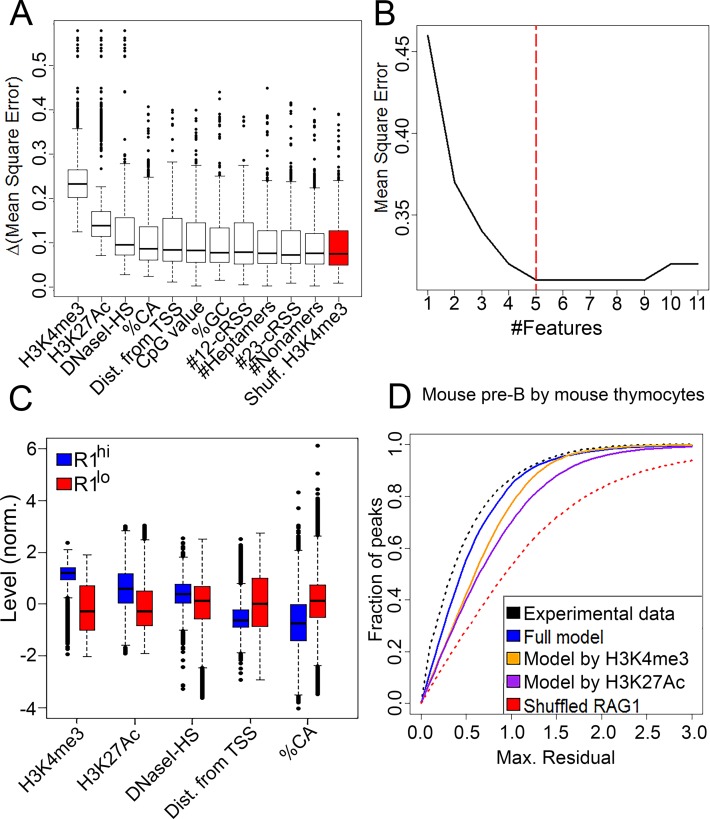
Figure 3.
Construction of a RAG1 binding model. (A) Candidate features were ranked by their importance for the RAG1 targeting model as measured by Δmean square error (MSE) (see ‘Materials and Methods’ section). The benchmark for importance was determined using a random feature, created by scrambling of H3K4me3 values (red). (B) The regression model was applied using an increasing number of features added by the ranking of their importance. Red dashed line shows the subset that yielded the minimal MSE and was used in subsequent analyses. (C) Levels of selected features at RAG1hi versus RAG1lo H3K4me3 peaks. RAG1hi peaks were higher in H3K4me3 and H3K27Ac, closer to transcription start sites and depleted in CA dinucleotides compared to RAG1lo peaks (P = 0 for all features). (D) The RAG1 targeting model based on mouse thymocytes was used to predict the RAG1 distribution in mouse pre-B cells. Regression error characteristic (REC) curve, plotting the fraction of the peak set (y-axis) that was predicted with a certain maximal residual (x-axis), illustrate prediction quality of the full regression model (blue line), compared with regression using either H3K4me3 only (orange line), H3K27Ac only (purple line). Upper and lower limit curves were traced by calculating the residuals between ChIP-seq replicates (black dashed line) or a random feature (red dashed line), respectively.

