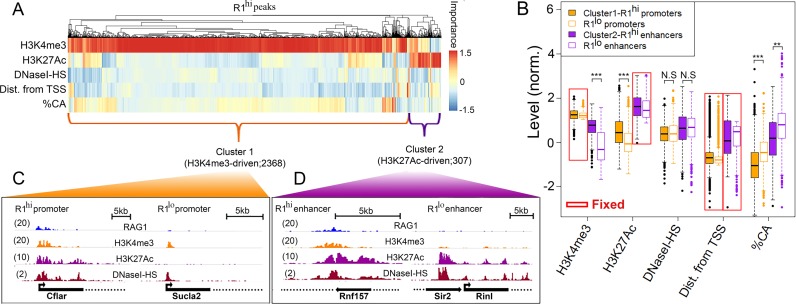
Figure 4.
RAG1 peaks segregate into two clusters. (A) Hierarchical clustering of RAG1hi H3K4me3 peaks according to peak-specific feature importance. Each column represents a RAG1hi peak and each row represents a feature. Feature importance is color coded. Dendrogram above the heat map represents the hierarchical clustering of the peak set. (B) Boxplots of the levels of each feature in RAG1hi promoter (orange; N = 2368) and enhancer (purple; N = 307) clusters (filled boxes) compared with RAG1lo regions (empty boxes; 1407 promoters and 1454 enhancers) selected to be comparable for certain ‘fixed’ parameters, as indicated by red boxes. (C and D) Snapshots of representative RAG1hi versus RAG1lo (C) promoters and (D) enhancers illustrate the levels of WT RAG1, H3K4me3, H3K27Ac and DNaseI-HS. The numbers in parentheses indicate the maximal RPKM.

