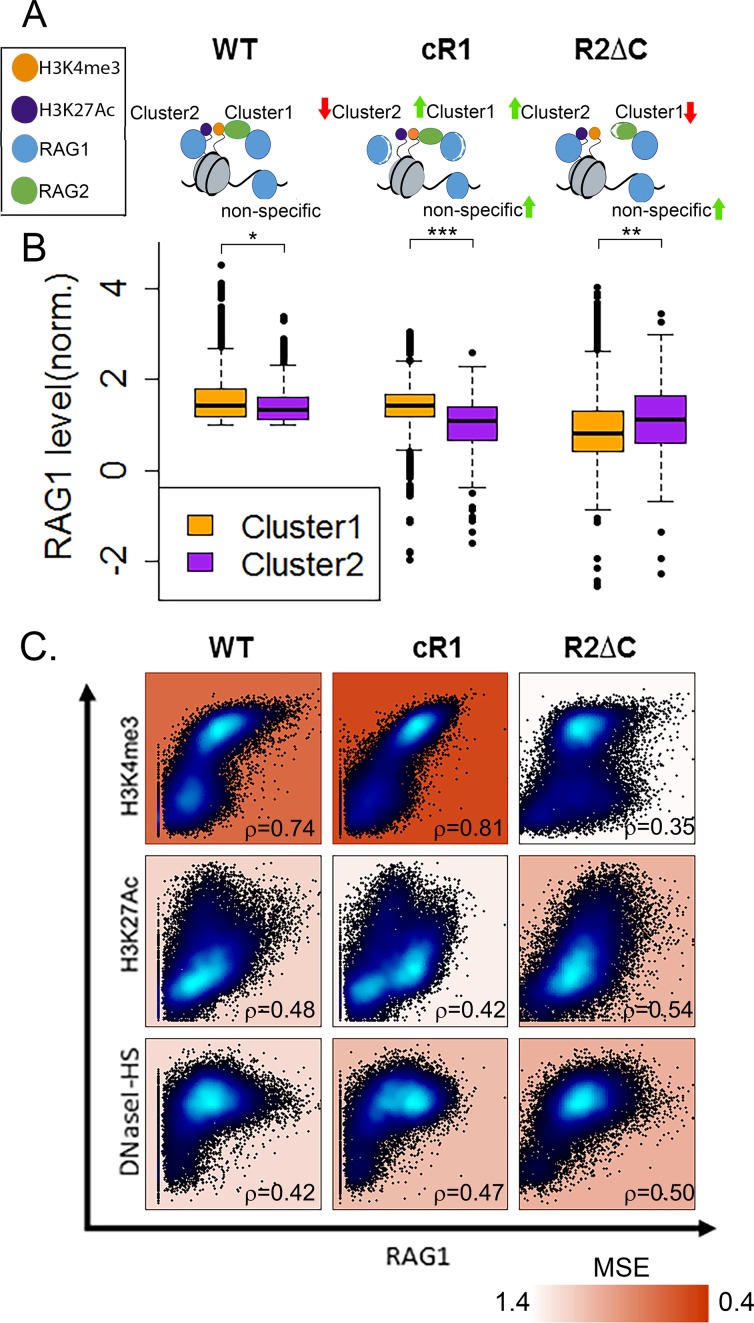
Figure 5.
RAG1hi clusters represent two modes of interaction mediated by different RAG1 and RAG2 domains. (A) Schematic representation of the expected RAG1 targeting interactions in wt, cR1 and R2ΔC genotypes. (B) Comparison of RAG1 levels in Cluster 1 (H3K4me3-driven) and Cluster 2 (H3K27Ac-driven) in WT, cR1 and R2ΔC genotypes. In both WT and cR1, RAG1 levels are higher in Cluster 1 than Cluster 2, but the differences are much greater in cR1 (t-test; P < 1e-5 and P < 1e-35, respectively). In R2ΔC, RAG1 levels are higher in cluster 2 (P < 1e-9). (C) Correlation between the levels of RAG1 in the indicated genotypes and H3K4me3, H3K27Ac or DNaseI-HS. Spearman correlation coefficients are indicated on each plot in the bottom right corner and the MSE is indicated by background color.

