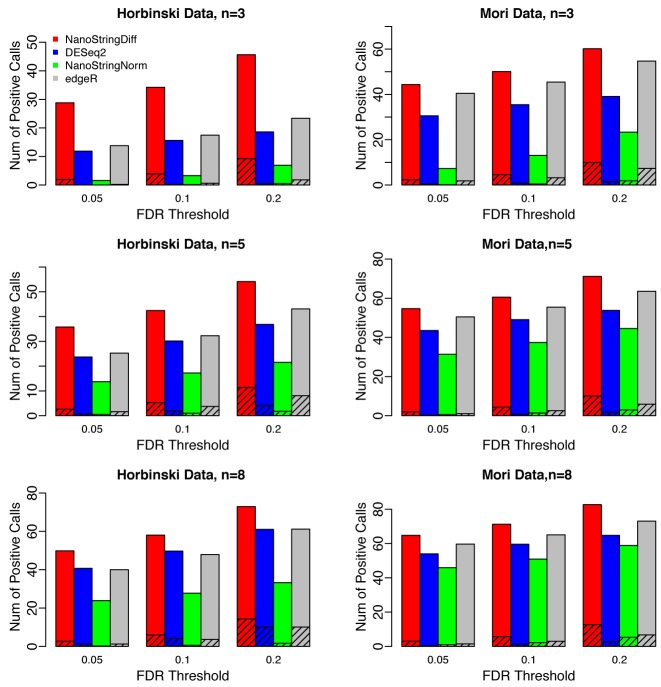
Figure 3.
Bar charts for number of positive calls under a given FDR threshold comparing different methods. Results were averaged across 100 datasets simulated based on the Horbinski data (left column) and Mori data (right column) with three, five or eight replicates. For each simulation scenario, three different FDR thresholds, 0.05, 0.1 and 0.2, were considered. The shaded area represents false discoveries, i.e. the number of non-DE genes within positive calls.

