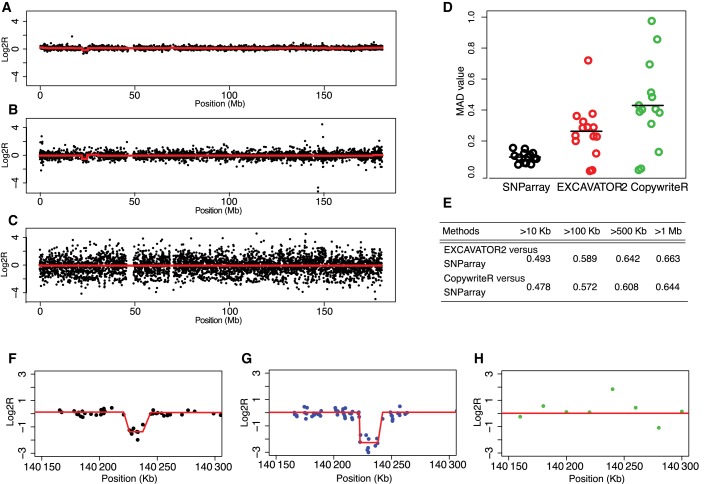
Figure 5.
Analysis on somatic data set. A total of 14 WES tumour/control samples pairs of Urothelial Bladder cancer were analysed using EXCAVATOR2 and CopywriteR, and results were compared to the SNP-array genotyping. Copy number profiles for the chromosome 5 of patient 251 with segmentation values depicted in red are shown for (A) SNP-array, (B) EXCAVATOR2 and (C) CopywriteR. MAD values for all 14 samples pairs are represented in (D). Table (E) shows the Spearman correlation coefficient values for different CNV sizes between the array-based profiles and those resulting from EXCAVATOR2 and CopywriteR. Finally, the ‘zoomed’ in region containing a potential deletion in the chromosome 5 of the patient 64 is showed with CN profiles and calls from (F) SNP-array, (G) EXCAVATOR2 and (H) CopywriteR.

