Figure 7.
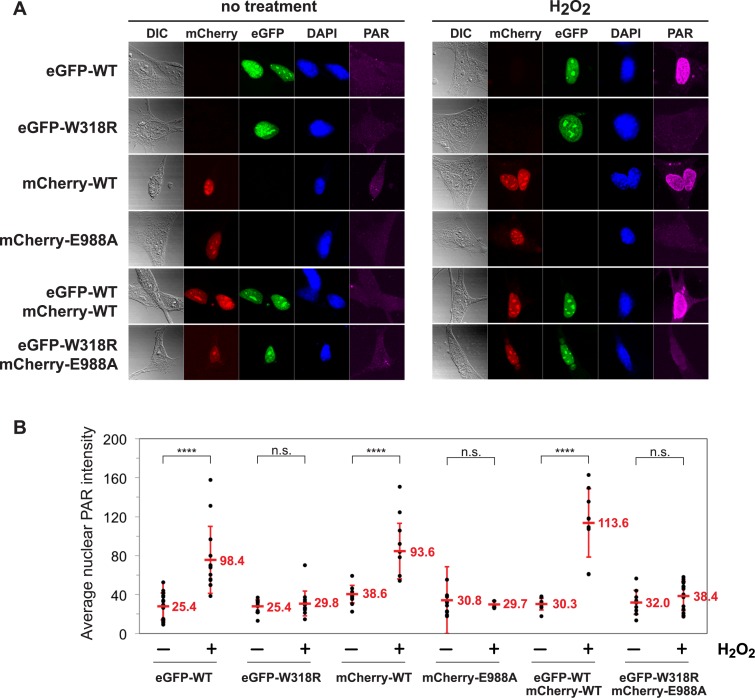
Cell-based analysis reveals no evidence of intermolecular PARP-1 activation. PARP-1−/− MEFs were transfected with PARP-1/WT, W318R, or E988A carrying either an eGFP or mCherry tag to show expression and nuclear localization. (A) Cells were treated with 10 mM H2O2 in serum-free media or mock-treated (no treatment, no H2O2) for 10 min before being washed with PBS and fixed with methanol and immunostained with mouse anti-PAR monoclonal antibody (10H) and Atto647N (STED) goat anti-mouse IgG antibody for analysis by immunofluorescence. Images are representative of at least 5 images taken at 40× magnification. Excitation of Atto647N was kept constant across every image, and the signal was adjusted by 1.5× across every image post-acquisition. (B) Fluorescent intensity of nuclear PAR staining across multiple cells. Individual cell values are depicted and the average signal and S.D. are shown. Statistical significance was determined using a Student's t test. ****P < 0.0001; n.s., no significance.

