Figure 8.
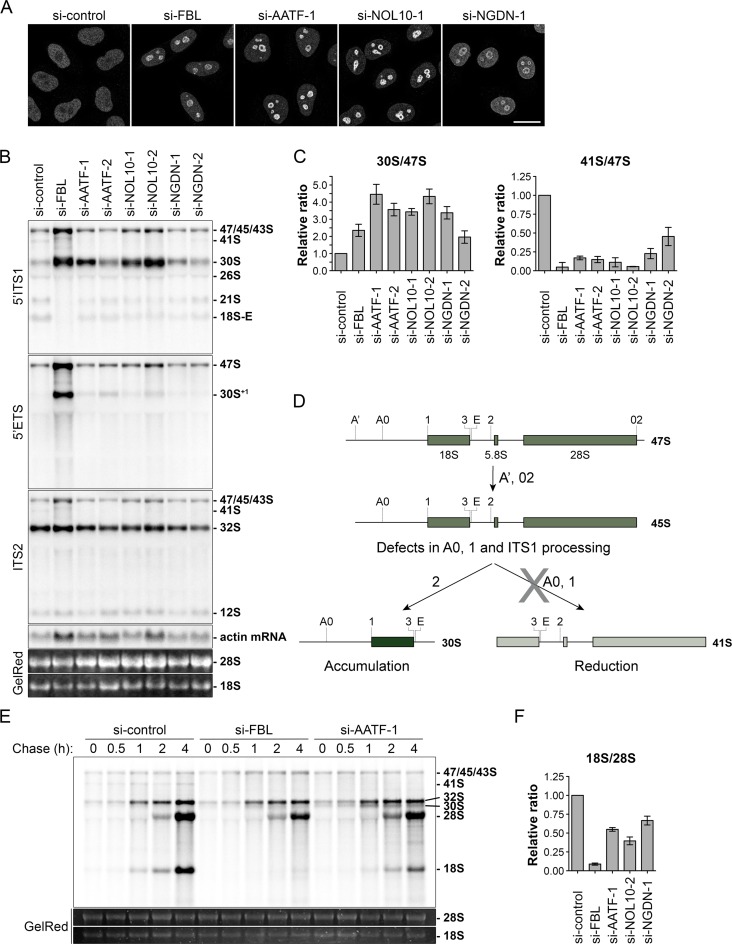
AATF, NOL10 and NGDN depletion causes pre-rRNA processing defects at cleavage sites A0, 1 and in the ITS1 region. (A) Indicated proteins were depleted by RNAi treatment for 72 h in HeLa cells. ENP1 localization was visualized by IF analysis after 2 h of LMB treatment (20 nM). Scale bar, 20 μm. (B) Northern blot analysis of total RNA extracted from HeLa cells after siRNA treatment for 72 h. Radioactively labeled probes binding to the 5′ITS1, 5′ETS, ITS2 or actin mRNA were used to detect the indicated rRNA precursors or mRNA. Mature 18S and 28S rRNA were visualized by GelRed staining on the membrane. (C) Quantification of three independent experiments using the 5′ITS1 probe as shown in (B) using ImageJ. The ‘47S’ (47S, 45S and 43S pre-rRNAs) pre-rRNA signal intensity was used for normalization. Mean ± SD (error bars). (D) Scheme illustrating pre-rRNA processing defects observed in (B). Depletion of AATF, NOL10 and NGDN leads to increased levels of 30S and reduced levels of 41S pre-rRNA, indicating lower efficiency in cleavage of 18S pre-rRNA at the sites A0, 1 and in the ITS1 region. (E) HeLa cells were subjected to RNAi for 48 h. Processing of newly synthesized pre-rRNA was analyzed after 33P pulse-labeling of HeLa cells. At the end of the indicated chase periods, RNA was extracted and separated by gel electrophoresis. Total mature 18S and 28S rRNA were stained with GelRed. (F) Quantification of three independent pulse-labeling experiments as shown in Supplementary Figure S5D. FBL, AATF, NOL10 and NGDN were depleted by siRNA treatment for 48 h and newly synthesized mature 18S and 28S rRNA were quantified after a chase period of 4 h. Mean ± SD (error bars).

