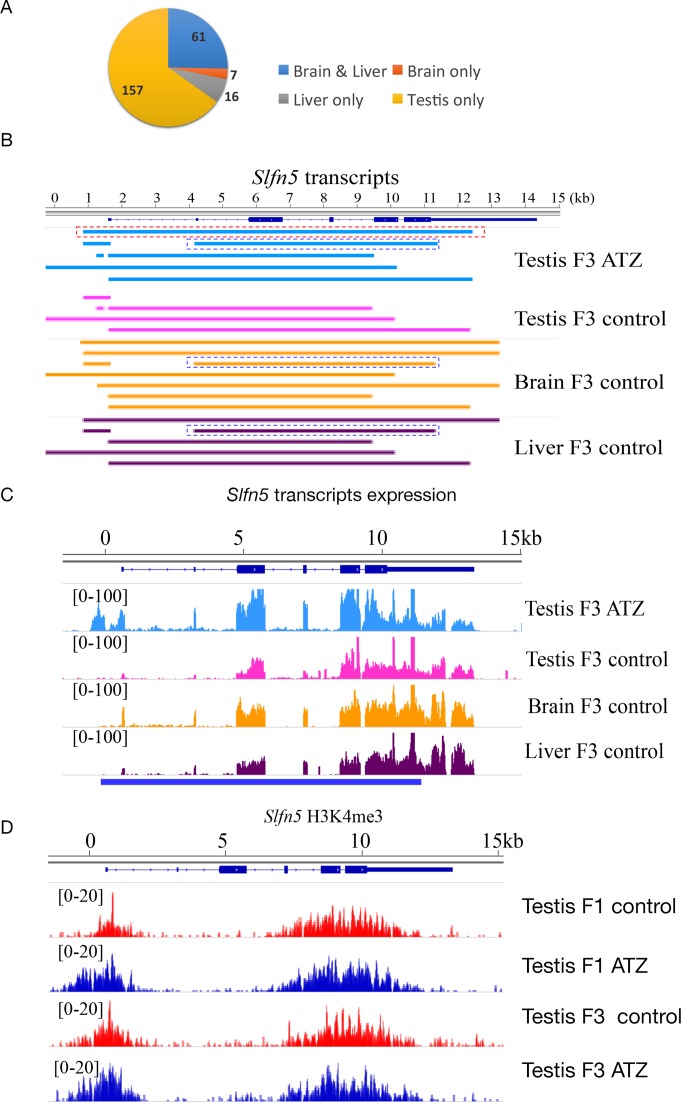
Figure 2.
The alternative initiation of mRNA transcription affects the third generation after treatment. (A) The pie chart represents the transcripts with new TSSs in the testis, liver and brain tissues. (B) The schematic presentation of Slfn5 transcripts. The blue dashed box shows a transcript that is expressing in ATZ-derived testis (FPKM = 1.13), this transcript is not expressing in the control testes but it is present in the control liver (FPKM < 0.01) and control brain (FPKM = 0.04); the red dashed box shows a new transcript, which is expressing in ATZ-derived testis (FPKM = 1.3), but is not expressing in the control testis, liver and brain. (C) Visualization of Slfn5 expression in testis brain and liver illustrated by IGV. (D) The H3K4me3 peaks in the promoters of Slfn5 genes in ATZ-derived males are wider in both F1 and F3 generation ATZ-derived males, two biological replicates were merged for simplicity. P-values in ChIP-seq were counted by comparison of normalized intensities at each peaks of two biological replicates from control and ATZ-derived samples with Limma statistical test. Benjamini–Hochberg (BH) correction was applied to the P-values and peaks with FDR less than 10% are considered statistically significantly different.

