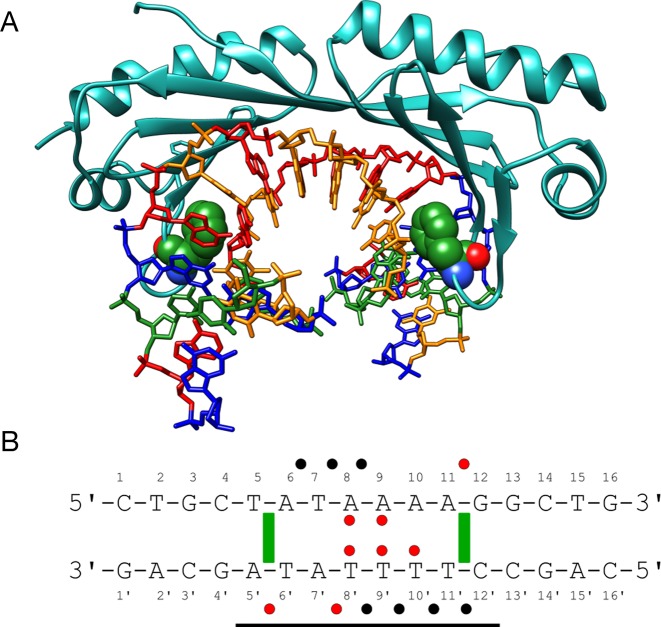
Figure 1.
(A) Structure of the human TBP/DNA complex (6). Two phenylalanine residues (Phe 193 and Phe 284, green spheres) are partially intercalated at the T5pA6 and A11pG12 steps. DNA is colored according to sequence (A = red, T = orange, G = blue, C = green). (B) DNA sequence used for the MD simulations with the binding site delimited by a horizontal black line. The ‘Watson’ strand of the oligomer is numbered 1–16 in the 5′-3′ sense and the ‘Crick’ strand is numbered 1′-16′ in the 3′-5′ sense. Salt bridges, hydrogen bonds and important apolar interactions observed during the MD simulations are indicated by black dots, red dots and green rectangles respectively.

