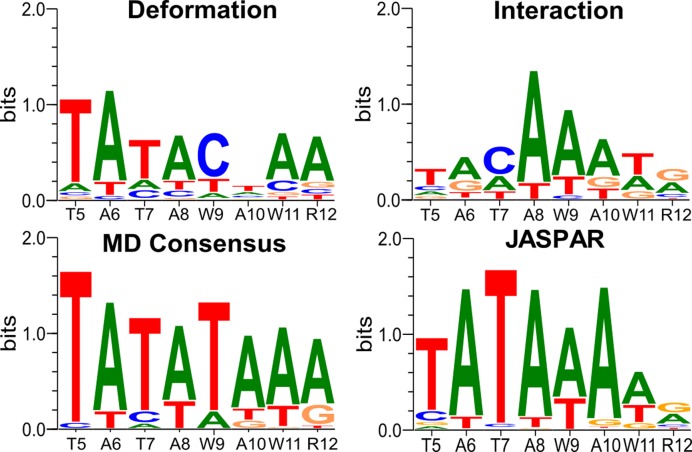
Figure 2.
PWM logos for the TBP/DNA complex obtained from the analysis of the MD trajectory. Top left: DNA deformation energy (indirect recognition). Top right: DNA–protein interaction energy (direct recognition). Bottom left: overall recognition. Bottom right: experimental logo from the JASPAR database. Each panel also shows the experimental consensus along the abscissa (W ≡ A/T, R ≡ A/G).

