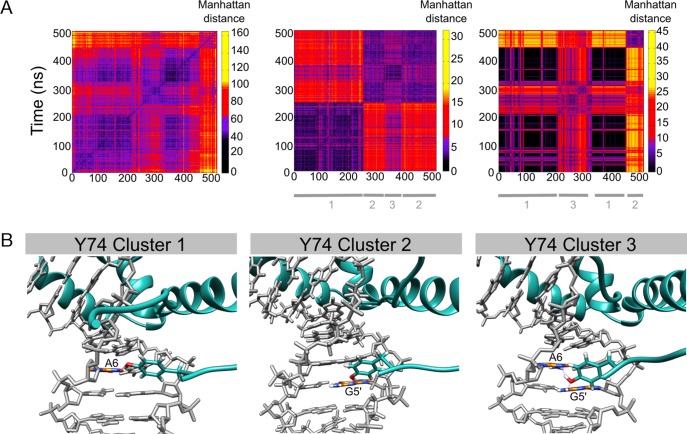
Figure 4.
Clustering snapshots from the 500 ns MD trajectory of the SRY/DNA complex. (A) Manhattan distance matrix for all protein–DNA base contacts (left), for tyrosine 74 (center) and for arginine 78 (right). The vertical scale shows increasing distances (black → yellow). (B) Alternative orientations observed for tyrosine 74: bound to A6(N3), bound to G5′(N3), bidentate interactions with A6(N3) and G5′(N2).

