
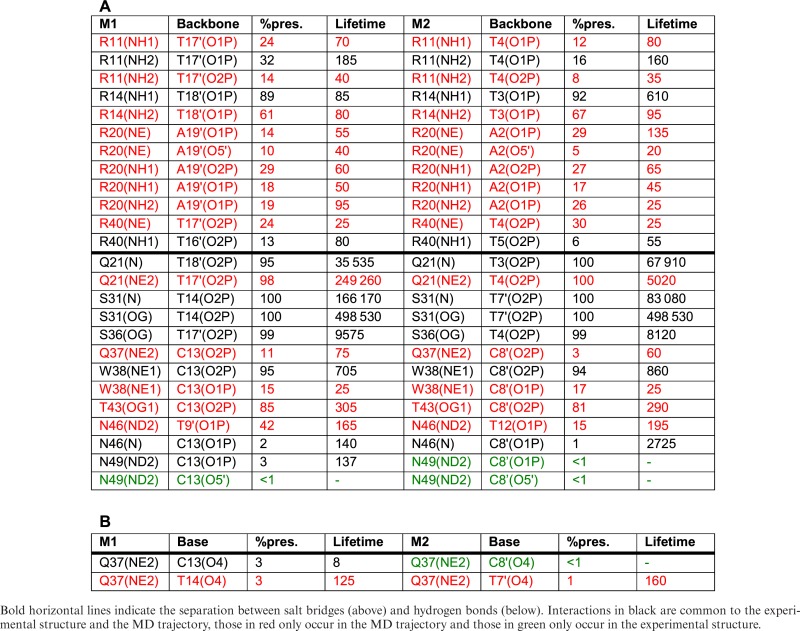
Table 3. P22 interactions with the DNA backbone (A) and the bases (B) showing percentage presence during the 1 μs MD trajectory and the average lifetime (ps) for each monomer (M1 and M2).
|
Official websites use .gov
A
.gov website belongs to an official
government organization in the United States.
Secure .gov websites use HTTPS
A lock (
) or https:// means you've safely
connected to the .gov website. Share sensitive
information only on official, secure websites.
|
|