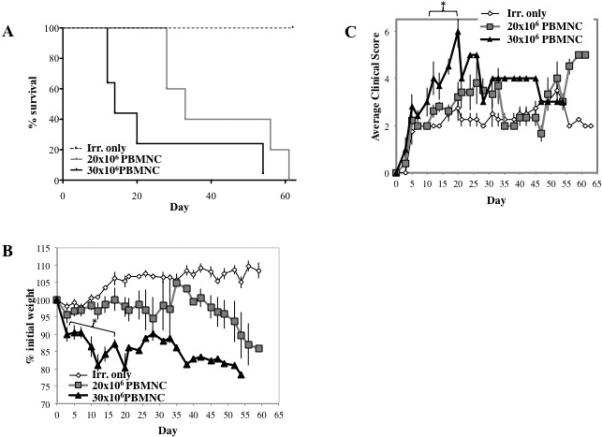
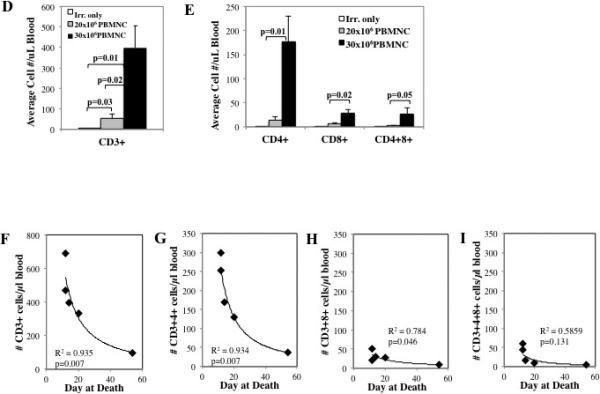
Figure 3. Optimizing the murine/NHP xenogeneic model of GVHD.


To determine the effect of cell dose on xeno-GVHD, NSG mice were irradiated (200 cGray) and administered PBS only, 20×106 PBMNC or 30×10 PBMNC. Disease severity was measured by survival (p<0.05 for 20×106 vs. 30×106 PBMNC) (A), weight loss (B) and GVHD score (C). To assess peripheral expansion of NHP T cells, mice were bled on day 10, and T cells were phenotyped and enumerated by flow cytometry. Quantitation of the total number of T cells (D) or T cell subsets (E) per μl blood on day 10 from mice receiving 20×106 or 30×106 NHP PBMNC (n=5 for 20×106 and 30×106 PBMNC) (n=5 for 20×106 and 30×106 PBMNC). Correlation between survival and total CD3+ T cells (F) or CD4+, CD8+ and CD4+8+ subsets (G-I, respectively) in blood on day 10. n=5 mice per group. * denotes days when p<0.05 for average weight and clinical score for both fresh and frozen/thawed PBMNC + Irr. compared to either Irr. or PBMNC only. * denotes days when average weight or clinical score for 30×106 PBMNC has p<0.05 compared to 20×106 PBMNC and Irr. only. R2 values were determined by Pearson correlation analysis.
