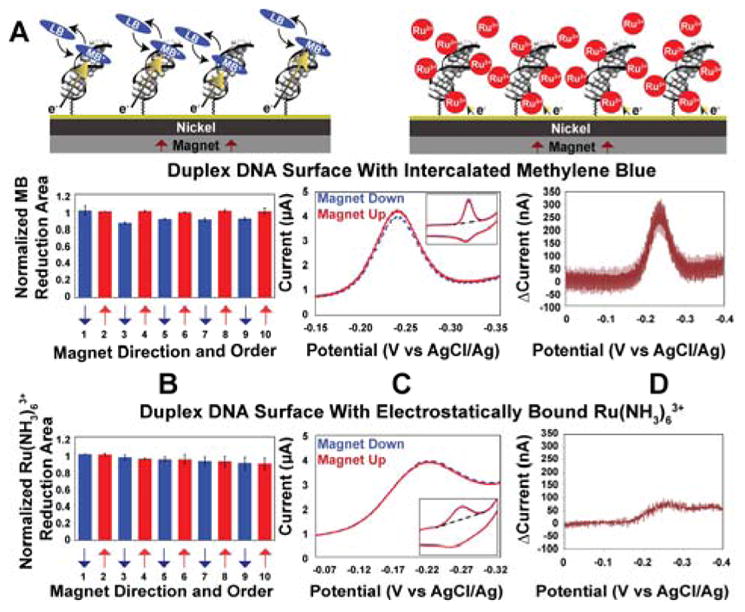
Figure 1. Cyclic voltammetry on electrodes modified with 16 bp dsDNA.

A. Illustration of the dsDNA modified electrodes with 1 μM methylene blue (MB) (left) or 10 μM Ru(NH3)63+ (right). B. For intercalated MB (above) and electrostatically bound Ru(NH3)63+ (below) reduction yield upon switching the magnetic field direction. Data were normalized to the first scan with the magnetic field pointing up. C. Representative cyclic voltammograms with the magnet up (red, solid) and magnet down (blue, dotted). D. Difference plot showing the current when the magnetic field is pointing up minus the current when the magnetic field is pointing down. The Ru(NH3)63+ experiments were typically done following MB experiments on the same surface.
