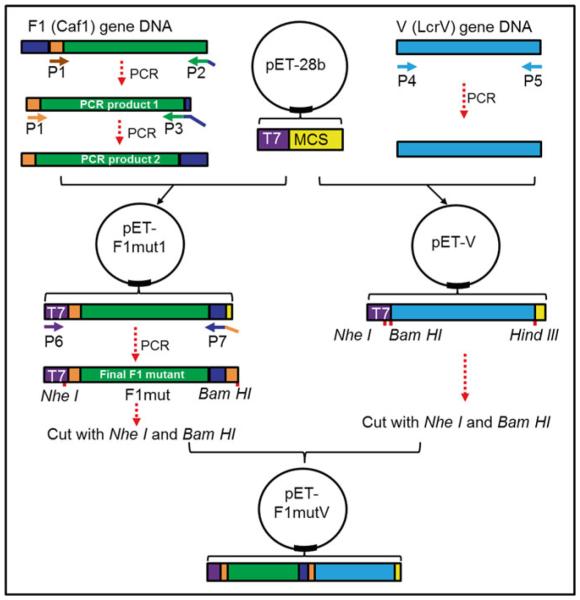
Fig. 2.
Cloning strategy to generate pET-F1mutV plasmid. T7 indicates T7 promoter sequence, MCS indicates multiple cloning site, P1–P7 indicate primers 1–7, blue indicates the first 14-aa residues of F1, and orange indicates aa residues 15–21 of F1. The remaining region of F1 is shown in green. V gene is shown in cyan. The linkers in F1mut or between F1mut and V are not shown

