Figure 5.
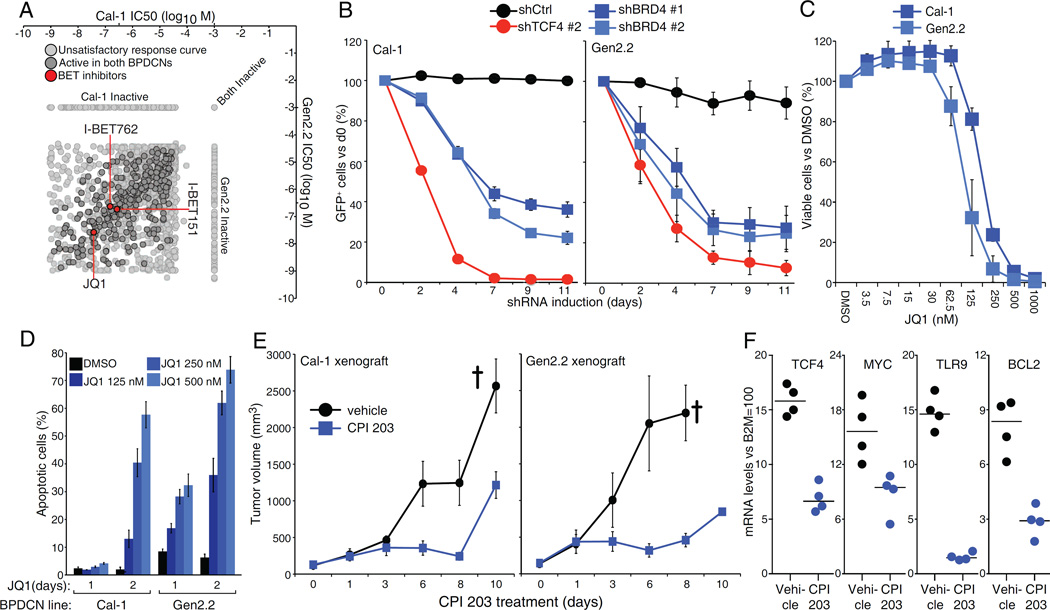
The bromodomain and extra-terminal domain BRD4 is required for BPDCN survival. A). Log10 molar IC50 plots comparing Cal-1 and Gen2.2 cells. Of the 1910 compounds screened, 314 showed activity in both BPDCN lines, after excluding inactive and poorly fitting compounds. BETi’s are highlighted in red. See Table S5. B) BPDCN cells were infected with Ctrl, TCF4 or BRD4 shRNAs. Shown is the fraction of live, shRNA expressing (GFP+) cells over time after shRNA induction, compared to the day 0 un-induced value. C) BPDCN cells were treated with either DMSO or the indicated amount of BETi JQ1. Cell viability was assessed by MTS assay at day 3 post-treatment. D) BPDCN cells were treated with either DMSO or the indicated amount of JQ1. The percentage of apoptotic cells (active Caspase-3+, cleaved Parp1+) is shown at day 1 and day 2 post-treatment. E) Human BPDCN xenograft models were established by subcutaneous injection of Cal-1 and Gen2.2 cells in NOD/SCID mice and treated with either vehicle or the BET Inhibitor CPI 203 (5 mg/kg) for the indicated time points. Tumor growth was measured as a function of tumor volume. The cross indicate the mice euthanized because of excessive tumor growth. F) Relative mRNA levels of TCF4 and 3 of its targets in Cal-1 xenografts from mice treated for 5 days with CPI 203 or vehicle control. Error bars represent SEM of triplicates. In E), Error bars represent SEM, n=4 mice for the vehicle group, n=6 mice for the CPI 203 group. See also Figure S5 and Table S5.

