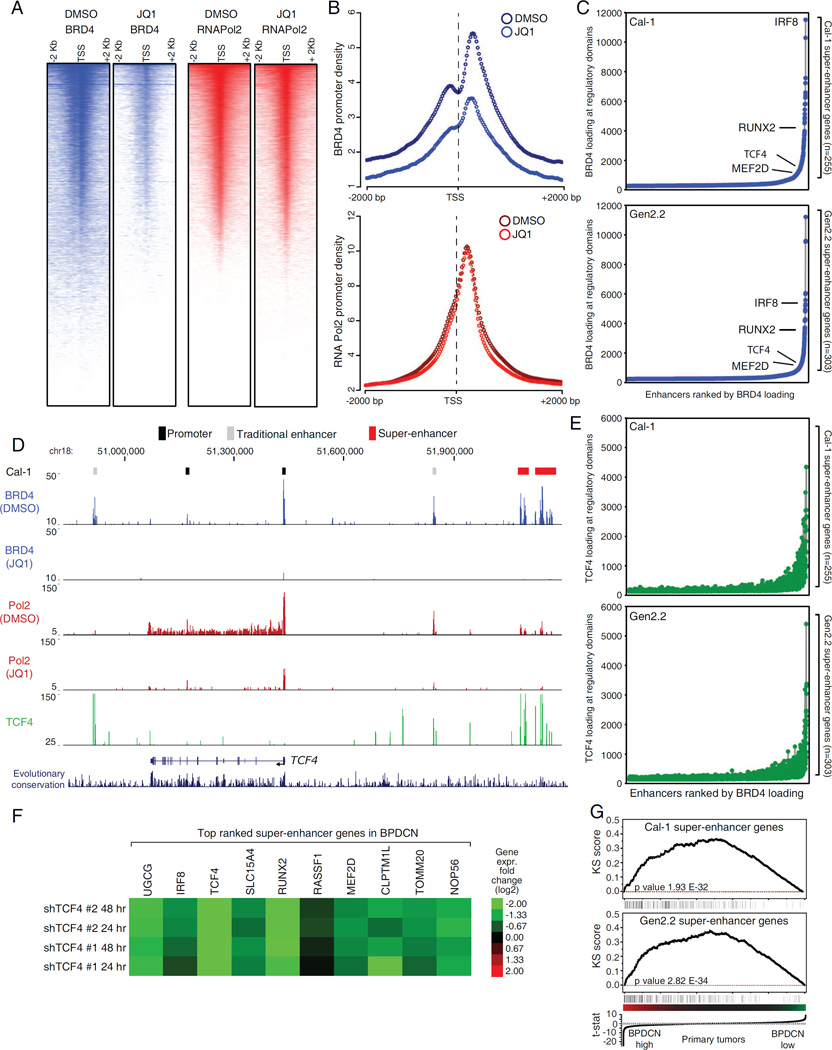
Figure 7.
Mapping the BRD4 dependent super-enhancers in BPDCN. A) Density heat-maps of promoter BRD4 (blue) and RNA Pol2 (red) in Cal-1 cells, after 12 hr treatment with either DMSO or 250 nM JQ1. Representative RefSeq accessions were ranked based on decreasing RNA Pol2 density in the DMSO treated cells and all the heat-maps were displayed accordingly. See Figure S7A for Gen2.2 cells. B) Meta-promoter profiles of BRD4 (blue) and RNA Pol2 (red) ChIP-Seq data in Cal-1 cells. See Figure S7B for Gen2.2 cells. C) Enhancers were ranked based on increasing BRD4 loading. Relevant SE containing genes are highlighted in the plot. D) The TCF4 locus ChIP-Seq tracks for BRD4 (blue), RNA Pol2 (red) and TCF4 (green) are shown for Cal-1 cells. See Fig S7E for Gen2.2 cells. E) Enhancers were ranked based on increasing BRD4 loading and the corresponding signal from TCF4 ChIP-Seq was then displayed. F) Heat-map of gene expression changes (Log2 FC) observed after TCF4 knockdown in the BPDCN Cal-1 line. G) Gene Set Enrichment Analysis (GSEA) showing the enrichment of SE genes among genes highly expressed in primary BPDCN samples. See also Figure S7 and Table S7.

