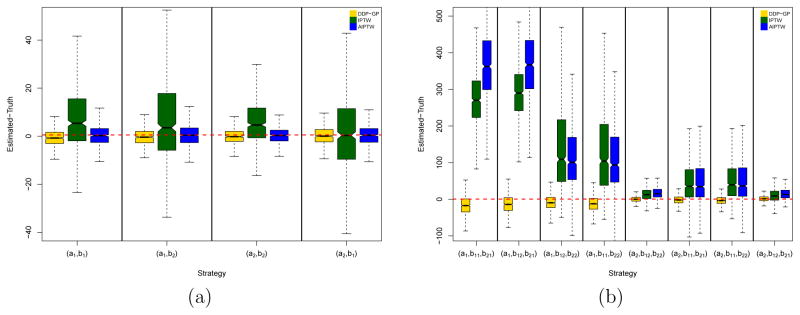
Figure 4.
(a) Simulation 3 and (b) simulation 4. The yellow boxplots show posterior estimated mean OS using the DPP-GP model under each of the regimes as a difference with the simulation truth over 1,000 simulations. The green and blue boxes show the corresponding inferences under the IPTW and AIPTW approaches, respectively. In each notched box-whisker plot, the box shows the interquartile range (IQR) from 1st quantile (Q1) to 3rd quantile (Q3), and the mid-line is the median. The top whisker denotes Q3+1.5*IQR and the bottom whisker Q1-1.5*IQR. The notch displays a confidence interval for the median, that is .

