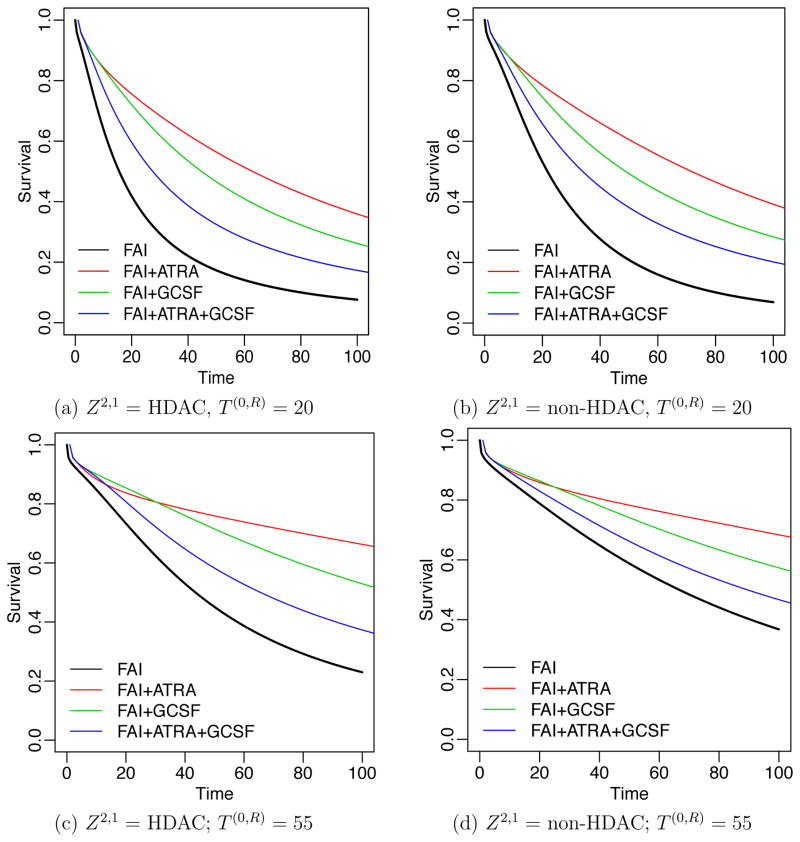
Figure 5.
Survival regression for T (R,D) in the AML-MDS trial. Panels (a)–(d) show the posterior estimated survival functions for a future patient at age 61 with poor prognosis cytogenetic abnormality, with T (0,R) and Z2,1 as indicated. Survival curves are shown for four induction therapies. Black, red, green and blue curves indicate Z1 = FAI, FAI+ATRA, FAI+GCSF and FAI+ATRA+GCSF, respectively.

