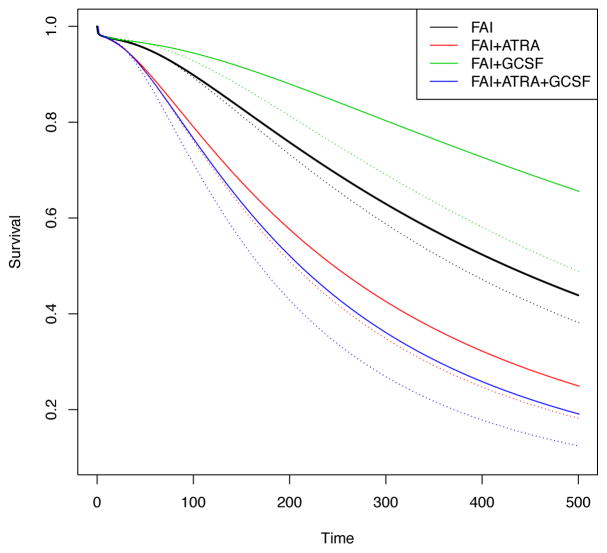
Figure 6.
The effect of T (0,C) on T (C,P) at age 61 with poor cytogenetic abnormality. Black, red, green and blue curves represent induction treatments FAI, FAI+ATRA, FAI+GCSF and FAI+ATRA+GCSF, respectively. Solid lines and dotted lines represent T (0,C) = 20 and T (0,C) = 30, respectively. The longer it takes to achieve C, the shorter the period of time that the patient remained in C.

