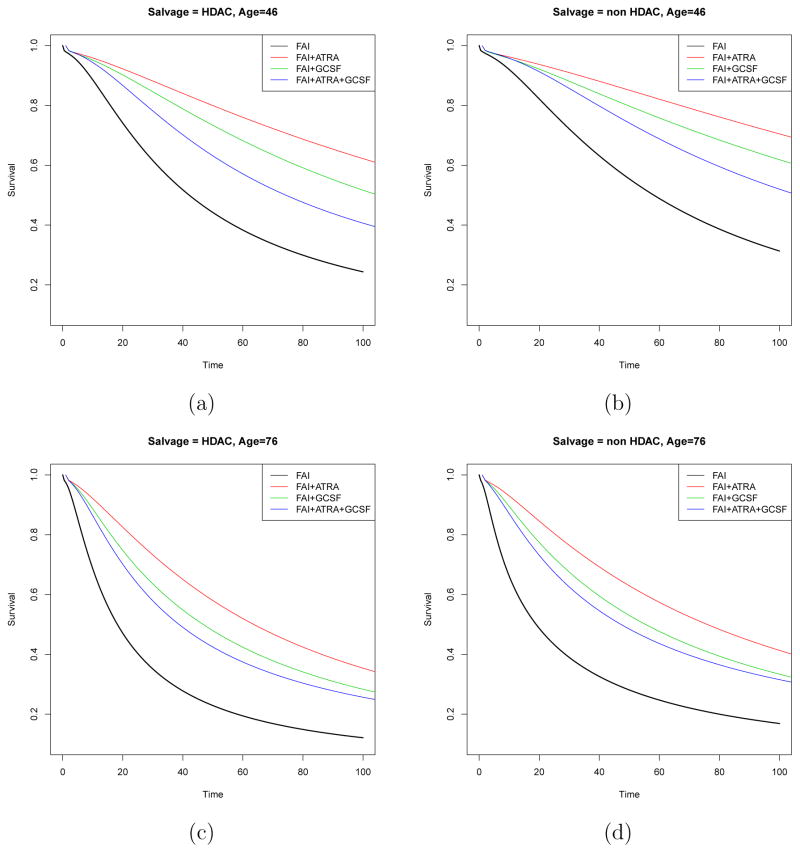
Figure 7.
AML-MDS trial data in transition (P, D): Panels (a) and (c) show the posterior estimated survival functions of patient at age 46 and 76 with poor cytogenetic abnormality assigned to salvage treatment HDAC for four induction therapies respectively. Panels (b) and (d) show the posterior estimated survival functions of patient at age 46 and 76 with poor cytogenetic abnormality assigned to salvage treatment non HDAC for four induction therapies respectively. Black, red, green and blue curves represent induction treatments FAI, FAI+ATRA, FAI+GCSF and FAI+ATRA+GCSF, respectively.

