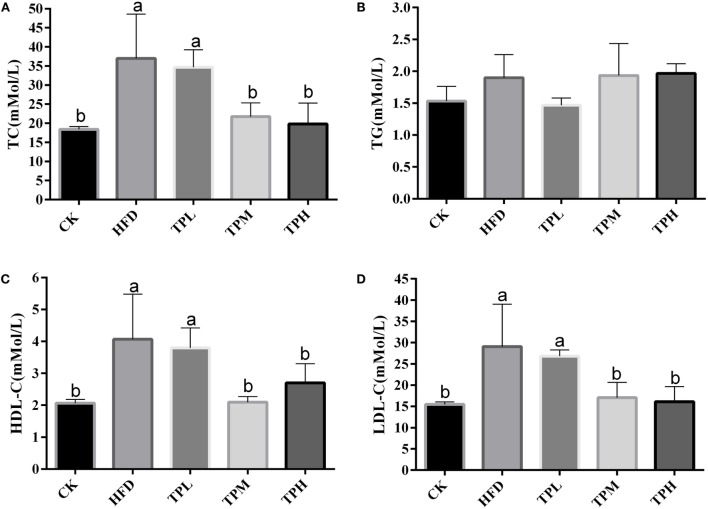
Figure 2.
Effect on the serum levels in the C57BL/6 ApoE−/− mice after diet with tea polyphenol 16 weeks. (A) TC; (B) TG; (C) LDL-C; and (D) HDL-C. Bars represent means ± SEM, n = 3. (a,b) Different lowercase letters indicate significant differences (p < 0.05); the same lowercase letter indicates that the difference is not significant (p > 0.05).

