
Figure 1.
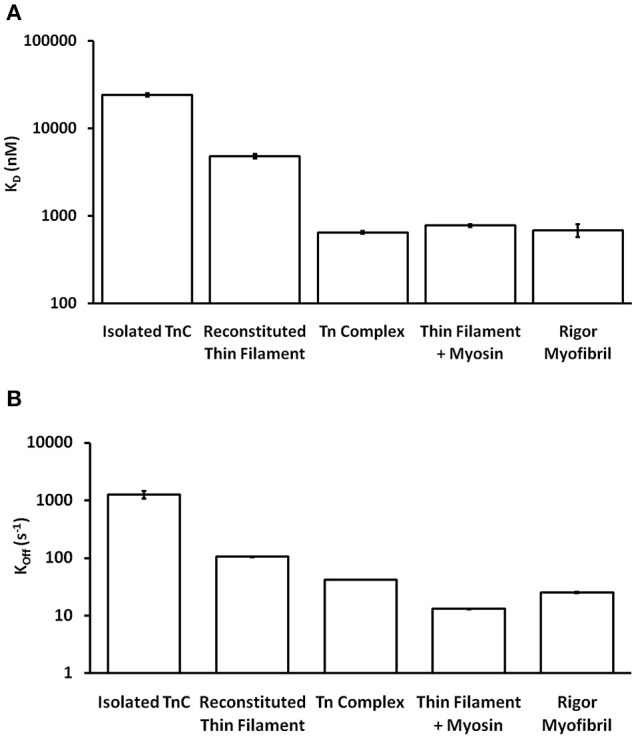
Comparison of apparent Ca2+ sensitivities and dissociation kinetics of different states of TnC. Panel (A) shows the apparent Ca2+ sensitivities ± SEM for TnC in the different biochemical systems that were extracted from our earlier publications (Tikunova and Davis, 2004; Davis et al., 2007; Little et al., 2012a,b). Panel (B) shows the apparent Ca2+ dissociation kinetics ± SEM for TnC in the different biochemical systems that were extracted from the same earlier publications. The y-axis is in a log scale making it difficult to see some of the error bars.