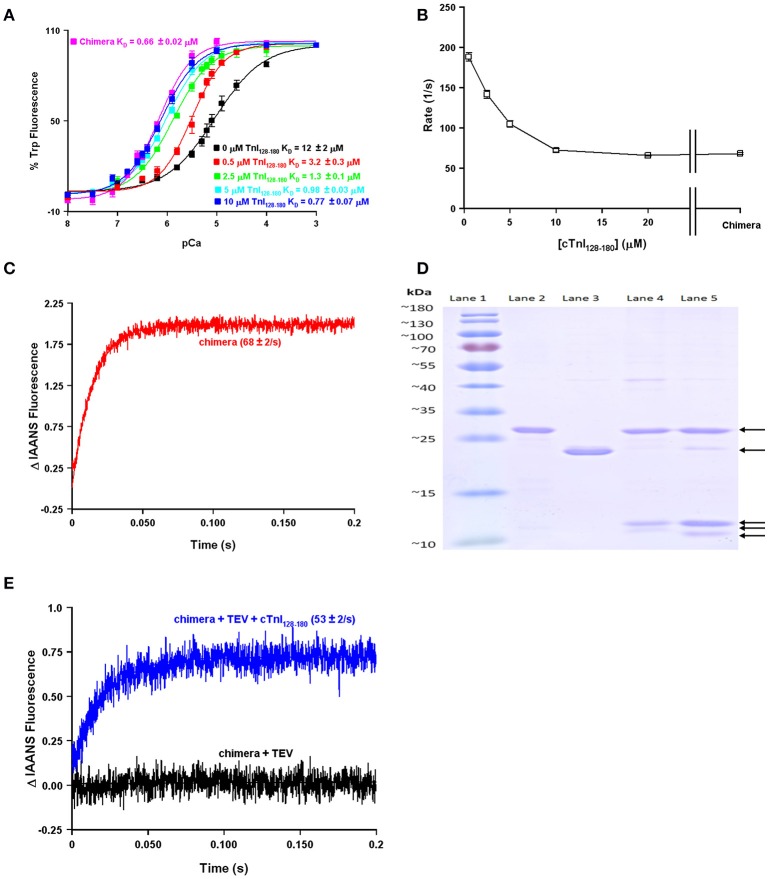
Figure 2.
Biochemical testing of the effective concentration of TnI. Panel (A) shows the apparent Ca2+ sensitivities of isolated TnCF27W in the absence or presence of increasing concentrations of TnI128−180 compared to that of the F27W chimera. Panel (B) shows the apparent Ca2+ dissociation rates from isolated TnC T53C-IAANS in the presence of increasing concentrations of TnI128−180 compared to that of the T53C-IAANS chimera. Panel (C) shows the apparent rate of Ca2+ dissociation from T53C-IAANS chimera. Panel (D) shows a representative SDS Page gel of: lane (1) molecular weight markers; lane (2) TEV; lane (3) uncut F27W chimera; lane (4) TEV digested T53C-IAANS chimera; lane (5) TEV digested F27W chimera. The arrows point to the following proteins in descending order TEV, uncut F27W chimera, TnI fragment, TnC T53C-IAANS fragment and TnC F27W fragment, respectively. The TnI fragments from the cut chimeras are of identical sequence and size, suggesting the lowest fragments are TnC. Panel (E) shows the apparent rate of Ca2+ dissociation from the TEV protease digested T53C-IAANS chimera before and after the addition of 30-fold excess TnI128−180.

