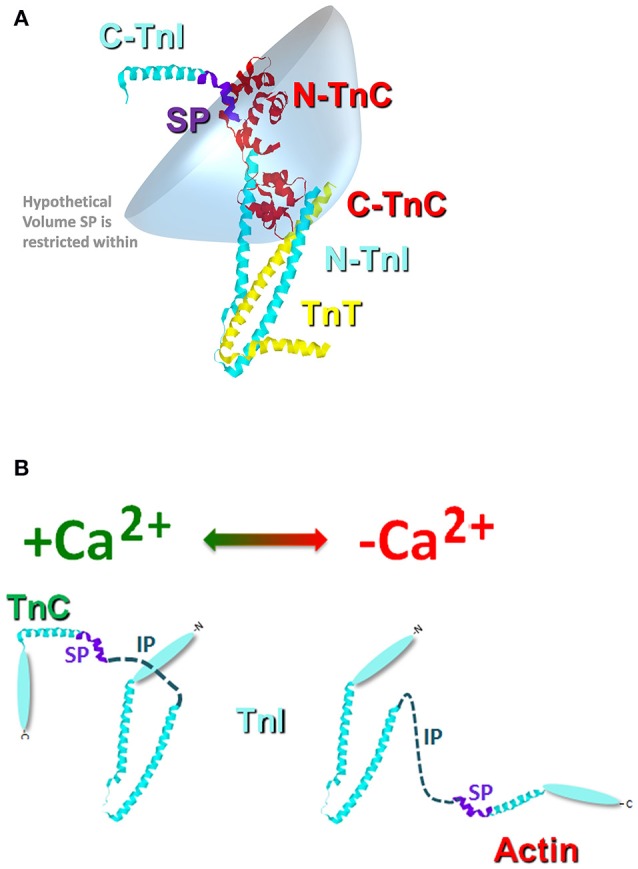
Figure 3.

Cartoon illustration of the effective concentration of TnI. Panel (A) shows the crystal structure of the Tn complex [cyan TnI (purple switch peptide); red TnC; and yellow TnT]. The blue shaded area represents a hypothetical volume in which the TnI switch peptide may be found. Panel (B) illustrates the potential structural change that occurs in TnI upon Ca2+ removal from TnC and TnI binding to actin.
