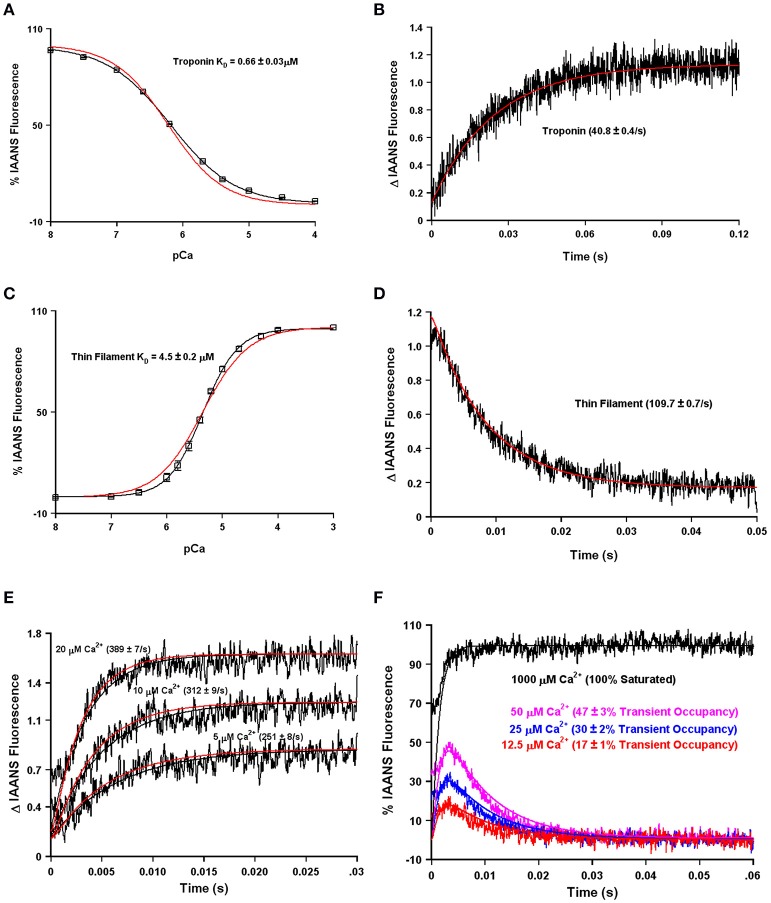
Figure 7.
Application of a four state model. Panels (A,B) in black show the apparent Ca2+ sensitivity and dissociation rates from the Tn complex as previously published (Davis et al., 2007). Panels (C,D) in black show the apparent Ca2+ sensitivity and dissociation rates from the reconstituted thin filament as previously published (Davis et al., 2007). Panel (E) in black shows the rates of Ca2+ association to the reconstituted thin filaments as previously published (Liu et al., 2012b). Panel (F) (noisy colored curves) shows the response of the thin filaments to artificial Ca2+ transients as previously published (Liu et al., 2012b). For Panel (A–E), the smooth red curves show the simulated output of the four state model. For Panel (F), all the smooth curves represent the simulated output of the four state model.

