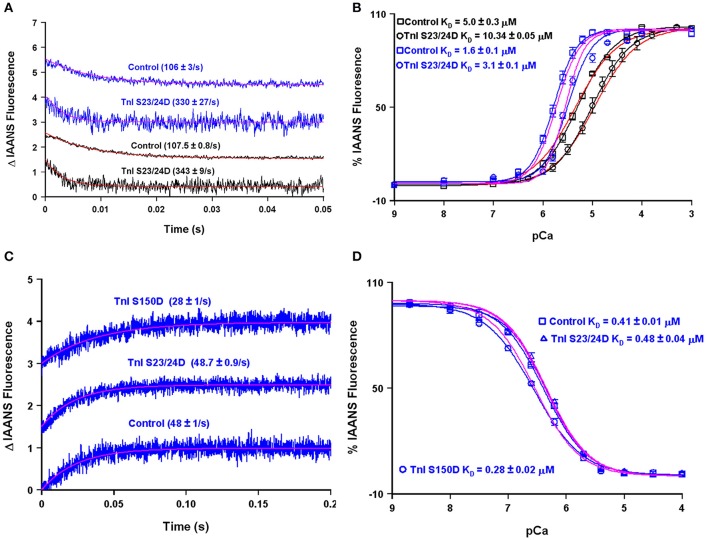
Figure 9.
Using the four state model to reconcile data from different research groups and predicting the molecular mechanism for S150 phosphorylation. Panels (A,B) show the apparent Ca2+ dissociation rates and sensitivities for thin filaments containing control or S23/24D TnI, whereas panels (C,D) show the apparent Ca2+ dissociation rates and sensitivities for the Tn complex containing control, S23/24D TnI or S150D TnI. For panels (A–D), the black traces are real data previously published from the Davis lab (Liu et al., 2014), the blue traces are real data previously published from the Biesiadecki lab (Nixon et al., 2014), the red traces are simulations for the Davis lab conditions, whereas the magenta traces are simulations for the Biesiadecki lab conditions.

