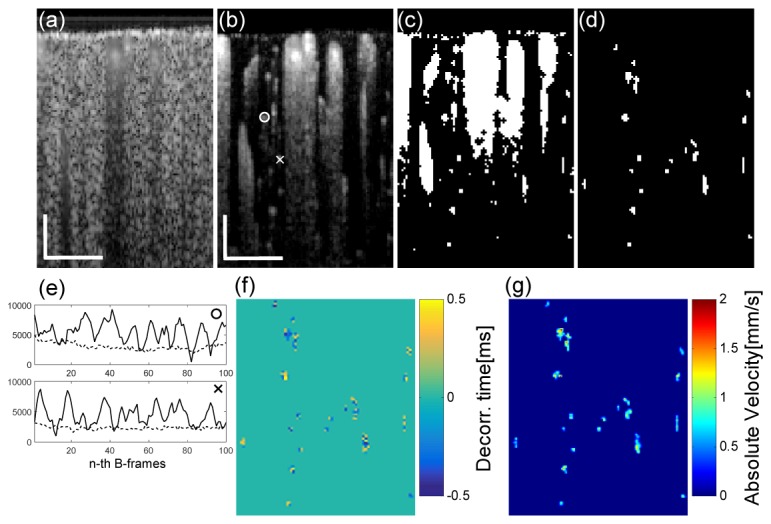
Fig. 2.

Procedure for estimating RBC velocity at single capillaries in the mouse brain cortex. (a) OCT B-scan of the mouse cortex through a cranial window. OCTA B-scan (b) at the same location as (a) and its binary image (c) are shown. (d) Capillary binary image isolated from (c). (e) Plots of intensity magnitudes extracted along with the ○ and × labeled points in (b) (solid lines) and their neighboring points in the static tissue (dotted lines). (f) Decorrelation time map. (g) Corresponding capillary absolute velocity map. Scale bars: 0.1mm.
