Fig. 4.

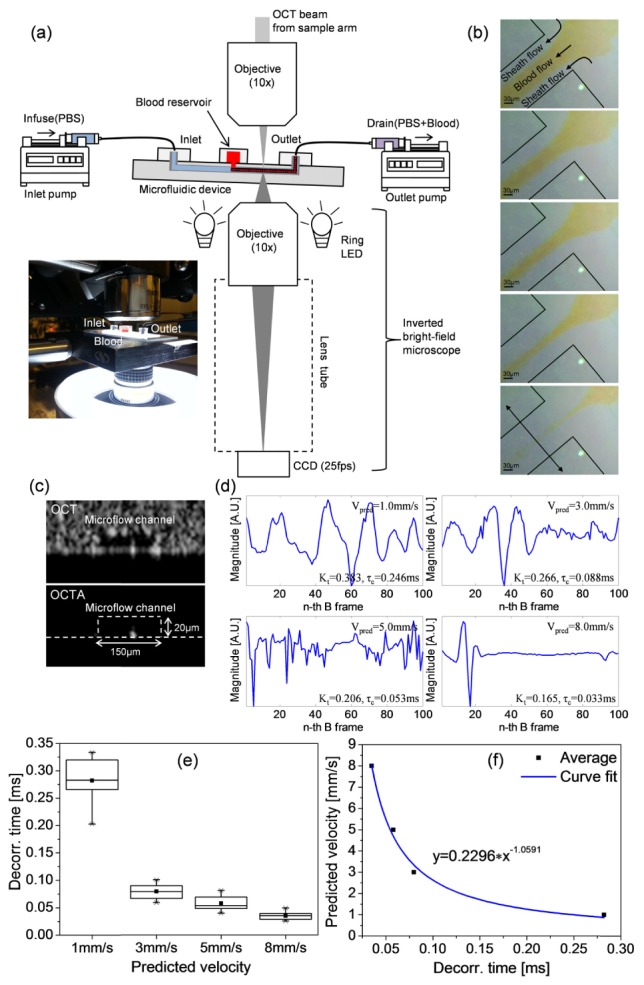
(a) Schematic of single capillary flow phantom imaging. Inset is a photograph of the set-up. (b) Time course snapshots captured by the inverted microscope (25fps) below the microfluidic device during hydrodynamic focusing of blood downstream. (c) (top) OCT B-scan of microfluidic device scanned at the location (arrow in the bottom snapshot in (b)), depicting a rectangle channel embedded in scattering PDMS, and (bottom) corresponding OCTA B-scan, highlighting the flow signal. (d) Extracted temporal profiles of OCT signals at the centroid of the focused blood streams in 100 consecutive OCT B-frames for each preset velocity: 1.0, 3.0, 5.0, and 8.0mm/s. (e) Distribution of decorrelation times repeatedly measured 15 times for each velocity. A curve fit of the average values in (e) shows the inverse relation of the decorrelation time to velocity in (f) with R2 = 0.987.
