Fig. 6.
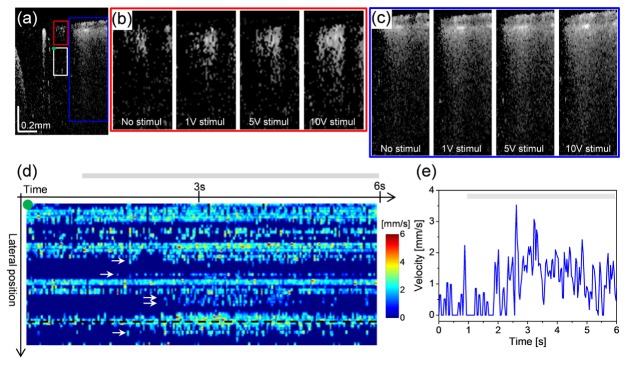
OCT capillary velocimetry for monitoring capillary flow response to hindpaw electrical stimulation. (a) OCTA B-scan of brain cortex through cranial window with no stimulation. During electrical stimulation, OCTA visualizes increase in diameter of surface vessels (in red and green boxes in (a)) along with the longer tail artifacts with increment of stimulus amplitudes (from 1V to 10V), highlighted in (b) and (c), respectively. (d) Time course velocity graph taken at capillary region in the cortical layers II/III (white box in (a)) at 10V stimulus amplitude, where few capillaries showed gradual increase in RBC velocities 1-2 seconds after onset of stimulation. The capillary hemodynamics is represented with a velocity profile (e) at dotted line in (d). The gray bars in (d) and (e) indicate the electrical stimulation period.

