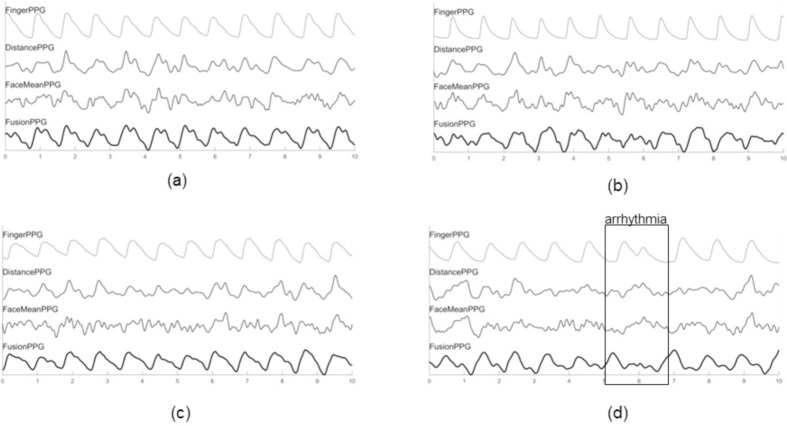
Fig. 6.
Extracted waveforms from the proposed and comparison methods across four participants. The selected waveforms were those that exhibited the strongest correlation from DistancePPG (a), FaceMeanPPG (b), FusionPPG (c), and a participant with arrhythmia (d). FusionPPG was able to extract strong waveforms across all participants, enabling the visual assessment of a cardiac arrhythmia (at t = 6 s).

