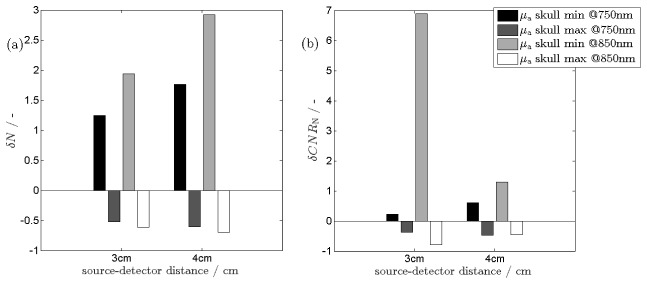
Fig. 6.
Relative changes in the number of detected photons at 2 wavelengths for minimal and maximal absorption coefficient of the skull in respect to its typical value (a) and the relative changes in contrast to noise ratio (b). The δN (δCNRN) values were calculate using Eq. (1) and (3) respectively.

