Abstract
Liver fibrosis is a major cause for increasing mortality worldwide. Preclinical research using animal models is required for the discovery of new anti-fibrotic therapies, but currently relies on endpoint liver histology. In this study, we investigated a cost-effective and portable photoacoustic/ultrasound (PA/US) imaging system as a potential non-invasive alternative. Fibrosis was induced in mice using CCl4 followed by liver imaging and histological analysis. Imaging showed significantly increased PA features with higher frequency signals in fibrotic livers versus healthy livers. This corresponds to more heterogeneous liver structure resulting from collagen deposition and angiogenesis. Importantly, PA response and its frequency were highly correlated with histological parameters. These results demonstrate the preclinical feasibility of the PA imaging approach and applicability of dual PA/US system.
OCIS codes: (170.3880) Medical and biological imaging, (170.0110) Imaging systems, (170.5120) Photoacoustic imaging, (170.7170) Ultrasound, (170.2680) Gastrointestinal
1. Introduction
Liver fibrosis is scarring of the liver caused by recurring injury, and is a clinically silent and slow disease developing over 20–40 years. The process is most often the result of either chronic hepatitis B or C infection (viral hepatitis), alcohol over-consumption (alcoholic liver disease) or obesity (fatty liver disease/non-alcoholic steatosis) [1,2]. These factors cause repeated damage to primary liver cells (hepatocytes) and invoke the infiltration of inflammatory cells and the deposition of extracellular matrix (ECM) proteins. If the damage is acute or self-limited, these changes are temporary and liver architecture is restored to its normal composition [1,2]. However, if the liver cells are damaged repeatedly, chronic inflammation and excessive accumulation of ECM proteins results in major scarring of the liver, accompanied by significant angiogenesis, and leading to portal hypertension [2,3]. This progressive fibrosis culminates into cirrhosis and end-stage liver failure leading to high morbidity and mortality worldwide [1,3,4]. The disease is mostly asymptomatic such that patients, when first visiting a clinic, are mostly in an advanced state of liver fibrosis.
Currently, there is no clinically effective treatment available for liver fibrosis; development of anti-fibrotic therapies is ongoing research. A large number of preclinical studies are being performed with experimental fibrotic animal models to evaluate the therapeutic efficacy of promising anti-fibrotic drugs. However, these preclinical studies rely on endpoint fibrotic analysis due to lack of a non-invasive imaging technique for the evaluation/monitoring of efficacy of anti-fibrotic drugs in animal models. Rather than just performing endpoint measurements, non-invasive imaging techniques would allow longitudinal monitoring of individual animals. Photoacoustic imaging (PA imaging, or PAI) is an imaging technique that can be of great benefit to preclinical imaging due to its high resolution, great imaging depth and its ability to provide functional information without the use of contrast agents [5,6]. Importantly, PAI has been applied in a wide range of preclinical applications including tumor models [7–9], cerebral imaging [10,11], burn wounds [12,13], pharmacokinetics [14], cardiovascular dynamics [15], rheumatology [16,17] and recently in preclinical differentiation of liver fibrosis and steatosis [18,19].
PAI relies on pulsed or intensity modulated light which – when absorbed by tissue chromophores such as hemoglobin – causes a small pressure build-up that is relaxed in the form of pressure waves. Harmless light is used, often near infrared, which can 'diffuse' up to several centimeters in living tissues. While this light diffusion typically prevents high-resolution imaging in optical imaging techniques, this is not the case with PA imaging. PAI can use the strong optical absorption contrast between vasculature and the surrounding tissues for high contrast imaging, and suffers little from background speckle [20]. In addition, by tuning the optical wavelength, spectroscopy is possible, which allows for instance the estimation of oxygen saturation of hemoglobin within vasculature.
Typical PA systems that are used in preclinical research, for example recently published by Xu et al. [19], rely on sizable and expensive lasers. Here we report a cost-effective and portable system, which is unique since it integrates a pulsed diode laser within the housing of a handheld imaging probe. Because of the integrated diode laser, no external laser and fiber optics are required, vastly reducing footprint and cost of the system. Traditionally, while affordable and small in size compared to traditional Q-switched lasers, pulsed laser diodes are not as powerful and have comparatively longer pulse lengths. The PA/US system described here minimizes this problem with the use of a powerful diode laser newly developed for PAI. Moreover, the custom diode laser is housed together with ultrasonic detection and is used in combination with a small-form-factor ultrasound scanner, making this cost-effective and low footprint system also flexible and portable. With the ultrasonic detection performed by an array from a commercial echography probe, PA/US system is also capable of high-quality ultrasound (US) imaging. Both modalities are thus combined in dual modality PA/US imaging, which enables robust non-invasive identification of the liver during experiments and accurate ROI (region-of-interest) selection.
In this study, we use the PA/US system to image the tissue remodeling that takes place during liver fibrogenesis in mice. This tissue remodeling is a highly heterogeneous sub-millimeter process, involving both collagen accumulation and angiogenesis. We initially quantified the results based on the extent of the PA response by calculating the number of reconstructed PA pixels above detection threshold. Next, we analyzed the relative changes in the PA frequency spectrum of liver signals, as raw PA response could also be affected by a change in the optical properties of the skin. We investigate whether single-wavelength PA frequency analysis can be used to assess the structural heterogeneity. Finally, the obtained results were correlated with histological assessment, both to collagen I (reflecting ECM deposition/scar formation) and CD31 staining (angiogenesis).
2. Materials and methods
2.1 CCl4-induced liver fibrosis mouse model
All the animals (male mice, 6-8 weeks old) were obtained from Harlan (Zeist, The Netherlands). Animals received a normal diet and 12h light and 12h dark cycle. All the animal experiments in this study were performed in strict accordance with the guidelines and regulations for the Care and Use of Laboratory Animals, Utrecht University, The Netherlands. The experimental protocols were approved by the Institutional Animal Ethics Committee of the University of Twente, The Netherlands.
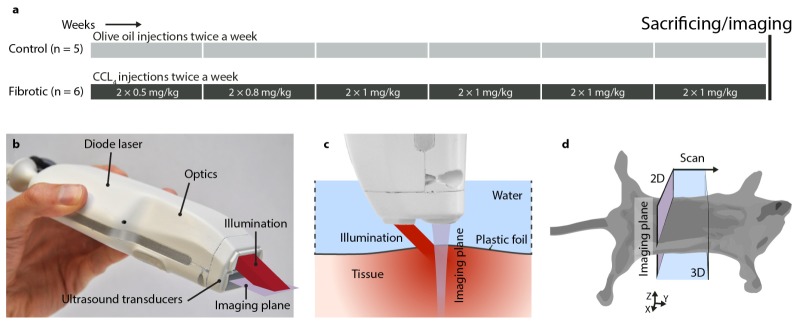
Liver fibrosis was induced in male Balb/c mice by administration of increasing concentrations of carbon tetrachloride (CCl4, prepared in olive oil) for 6 weeks (n = 6), while control mice received olive oil (n = 5). After 6 weeks, mice were euthanized, imaged immediately using photoacoustic/ultrasound dual probe, and livers were collected for the subsequent histological analysis (see Fig. 1).
Fig. 1.
Experimental setup: (a) experimental setups for CCl4-induced liver fibrosis mouse model. CCl4 was administered to mice for 6 weeks to induce liver fibrosis. Control mice are healthy mice that received olive oil. (b) bimodal photoacoustic and ultrasound hand held imaging probe, (c) photoacoustic and ultrasound imaging setup and (d) experimental imaging setup, and scanning plane and direction in mice.
2.2 Photoacoustic/ultrasound imaging system
A compact and cost-effective imaging system was used – capable of dual modality imaging with both photoacoustics and ultrasound. The system, developed as part of European project FULLPHASE, is composed of a MylabOne portable ultrasound scanner (ESAOTE Europe, Maastricht, the Netherlands), and a PA/US probe with a pulse energy of 1 mJ in 130 ns; up from 0.5 mJ in an earlier prototype [21]. As shown in Fig. 1(b), the probe houses a diode laser module with beam-shaping optics and an output prism for delivery of nanosecond light pulses at 808 nm. The laser module is designed and manufactured for the PA/US probe by Quantel (Paris, France). The module is comprised of four stacks of diode lasers by OSRAM (Regensburg, Germany) and is powered by a custom laser driver by Brightloop (Paris, France). A diffractive optical element by Silios (Peynier-Rousset, France) in combination with two cylindrical lenses shape the laser output into a rectangular shape of 2.2 mm by 17.6 mm (1/e2). Ultrasonic detection is performed by an array of 128 piezoelectric transducers, which register photoacoustic pressure waves and emit and detect pulse-echo ultrasound. The ultrasound transducer is based on an ESAOTE SL3323 echography probe, with a 7.5 MHz center frequency with a 100% one-way bandwidth from 2.5 MHz until 10 MHz.
The imaging probe was mounted on a translation stage for the purpose of this study. The animals were shaved and sacrificed immediately before imaging. Imaging was done on the sacrificed mice to exclude the possibility of encountering motion artefacts in this study. Mice were covered with a thin plastic foil, which had its edges raised to allow a layer of water for the transmission of PA and US pressure waves (see Fig. 1(c)). Mice were scanned in a 15 mm range with 16 positions 1 mm apart, (5 min average scan time), which enabled volumetric rendering of the liver. At each step, photoacoustic data was recorded by accumulating pressure transients over 500 laser pulses at 2 kHz. In addition, B-mode ultrasound scans were acquired at each step. Ultrasound frames were recorded in slices of 30 mm wide lateral by 20 mm deep, and photoacoustic frames in slices of 15 mm lateral by 20 mm deep. A Fourier domain algorithm was used to reconstruct the initial PA image [22]. This reconstructed PA image was compressed logarithmically to increase the dynamic range and overlaid on the grayscale US image for 2D visualization of each step. The dynamic range and image gain were kept constant over all images. A Matlab algorithm was developed to select the liver region of interest (ROI) and was used to select the relevant data for 3D visualization using VolVIEW. The Matlab algorithm was further used to quantify the fibrosis from PA images, and determine from the liver ROI the number of PA pixels above the detection threshold. The quantification metric was computed per scan position per mouse and results were averaged per mouse over the scan positions where the liver was visible, yielding one value per metric per mouse.
2.3 Immunohistochemistry
After imaging, liver tissues were harvested and transferred to Tissue-Tek OCT embedding medium (Sakura Finetek, Torrance, CA), and snap-frozen in 2-methyl butane chilled in dry ice. Cryosections (4 μm) were cut using a Leica CM 3050 cryostat (Leica Microsystems, Nussloch, Germany). The sections were air-dried and fixed with acetone for 10 min and were rehydrated with PBS and incubated with the primary antibody in appropriate dilution (refer to Appendix Table 1:) for 1h. Endogenous peroxidase activity was blocked by 3% H2O2 prepared in methanol. Sections were then incubated with horseradish peroxidase (HRP)-conjugated secondary antibody for 1h, washed and incubated with HRP-conjugated tertiary antibody for 1h. Thereafter, peroxidase activity was developed using AEC (3-amino-9-ethyl carbazole) substrate kit (Life Technologies) for 20 min and nuclei were counterstained with hematoxylin (Fluka Chemie, Buchs, Switzerland). Sections were mounted with Aquatex mounting medium (Merck, Darmstadt, Germany) and slides were scanned using Hamamatsu NanoZoomer Digital slide scanner 2.0HT (Hamamatsu Photonics, Bridgewater NJ).
Table 1. Antibodies used for the immunohistochemistry.
| Primary Antibody | Source | Dilution |
|---|---|---|
| Polyclonal goat anti-collagen I | Southern Biotech | 1:100 |
| Monoclonal rat anti-mouse CD31 | Southern Biotech | 1:100 |
|
| ||
| Secondary Antibody | Source | Dilution |
|
| ||
| Polyclonal rabbit anti-goat IgG | DAKO | 1:100 |
| Polyclonal goat anti-rabbit IgG | DAKO | 1:100 |
| Polyclonal rabbit anti-rat IgG | DAKO | 1:100 |
High resolution scans were viewed using NanoZoomer Digital Pathology (NDP2.0) viewer software (Hamamatsu Photonics). About 20 images (100x) of entire section (from NDP) were imported into NIH ImageJ software (NIH, Bethesda, MD) and were analyzed quantitatively at a fixed threshold.
2.4 Statistical analyses
All the data are presented as mean ± standard error of the mean (SEM). The graphs and statistical analyses were performed using GraphPad Prism software version 5.02 (GraphPad Prism Software, Inc., La Jolla, CA, USA). The statistical comparison between the control and fibrotic groups was performed using an unpaired students’ t-test. Correlations between the histological parameters and photoacoustic or ultrasound imaging were assessed using Pearson's correlative analysis. The dot plots for all the correlations were generated using the GraphPad Prism. Statistical significance was defined as p < 0.05.
3. Results
3.1 Photoacoustic/ultrasound imaging and quantification
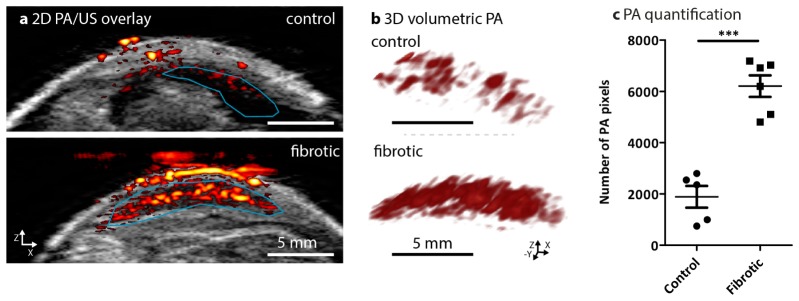
The PA/US probe’s imaging plane was positioned transverse to the mice as shown in Fig. 1(d). Then, the liver was scanned from posterior to anterior using the probe. At each imaging position ultrasound and photoacoustic images were co-registered resulting in PA/US overlaid images such as those shown in Fig. 2(a). These overlay images showed the ultrasound backscatter in gray scale: with on top the mouse skin on the ventral side, with below in bright echoic tissue and a dark hypoechoic liver. The red-and-yellow structures were the reconstructed photoacoustic sources overlaid on the ultrasound image, showing cross-sections of superficial blood vessels and the liver is visible below, showing varying amounts of PA response. The signal appearing above the livers in the fibrotic mouse was due to some interference which couldn't be completely reduced as for the healthy livers.
Fig. 2.
Non-invasive photoacoustic (PA) imaging and quantitation in control and CCl4-induced liver fibrosis mouse models. (a) Representative PA/US overlay scanned images of liver from healthy (control) mice (n = 5) and CCl4-treated fibrotic mice (n = 6). The confined blue lines denote the region of interest (ROI) registered during PA imaging and quantitation for the PA images. (b) Cross-view representation of the 3-dimensional volumetric reconstruction of PA imaging in the control livers and fibrotic mouse livers based on the ROI as shown in overlay images (see online Visualization 1 (397.9KB, MP4) and Visualization 2 (532.9KB, MP4) ). (c) The graph depicts the number of PA pixels (calculated in ROI within scanned livers, detailed in methods) in control livers and 6 weeks fibrotic livers. Each symbol represents an individual mouse. Data represent mean ± SEM. ***p<0.001 denotes statistical significance.
The blue curve in Fig. 2(a) indicates the liver region-of-interest (ROI) which was drawn manually based on the ultrasound image, in which the liver is visible as hypoechoic. This ROI was used for a 3D volumetric reconstruction of the adjacent PA slices recorded at each scan position (Fig. 2(b), see also video online). Notably, after 6 weeks of CCl4, mice livers showed an increased photoacoustic response compared to the healthy livers. This increase was quantified by the number of photoacoustic pixels that were above the noise floor within the liver ROI in the overlay images. This allowed the quantification of the physical extent of the PA response, which showed a significant increase in 6 weeks CCl4-treated fibrotic mice as compared to the healthy control mice (Fig. 2(c)).
3.2 Frequency analysis of photoacoustic liver signals
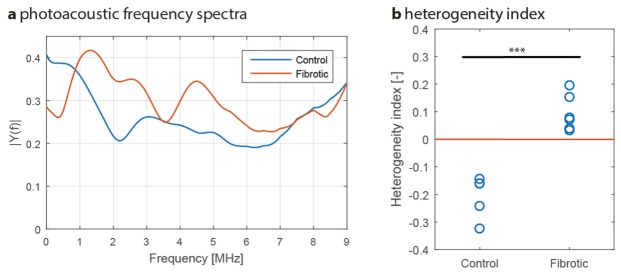
We further investigated the relationship between the tissue remodeling caused by fibrosis and the photoacoustic response. In the CCl4-induced liver fibrosis mouse model, the hepatic scar formation creates fibrotic nodules resulting in a highly heterogeneous liver. In addition, angiogenesis has also been described as a heterogeneous process during liver fibrosis. When irradiated by pulsed light, heterogeneous structures generate relatively high-frequency PA signals due to the smaller size of the structure components [23]. The frequency bandwidth of the system demonstrated in this study makes it most sensitive to absorbing structures from 600 µm and smaller in size. Hence, it is expected that it is the heterogeneous tissue remodeling that causes the enhanced PA response in fibrotic livers. To verify this, a frequency analysis of the PA signals from the reconstructed liver was carried out: using the ROIs drawn previously, axial pre-enveloped PA signals were Fourier transformed, averaged over the liver and compensated for the detectors’ frequency sensitivity. The resulting frequency spectra are shown in Fig. 3(a), with spectra corresponding to the same positions as in Fig. 2(a). The spectra showed a large difference in content: for instance, the peak in the low frequency range was shifted from 0.5 towards 1.5 MHz. In addition, extra spectral peaks appear at 2-5 MHz for fibrotic mouse livers, albeit smaller in amplitude. The peaks at 0.5 MHz and 1.5 MHz would correspond to structures of 2 mm in size (likely the light penetration distance in the liver) and 600 µm respectively [24] (i.e. fibrotic nodules).
Fig. 3.
Photoacoustic frequency analysis. (a) Example of a control PA spectrum versus the spectrum of a fibrotic liver. Notice the difference in spectral content, especially the shift in the spectral peak from 0.5 MHz (control, n = 5) towards 1.5 MHz (fibrotic, n = 6). (b) Contrast in PA spectral amplitude between 1.5 MHz and 0.5 MHz as quantified in a heterogeneity index. In (b), each circle represents an individual mouse. ***p<0.0001 denotes statistical significance.
To confirm these findings, the relative magnitudes of the spectral peaks (0.5 vs 1.5 MHz) were investigated for the fibrotic and control mice. For this, the contrast between the two peaks was calculated, and a ‘heterogeneity index’ HI is defined as:
where |Y(f)| is the spectral amplitude at frequency f. The heterogeneity index was below zero for control mice (lower signal at 1.5 MHz), whereas it was found to be above zero for fibrotic (larger signal at 1.5 MHz, significant at p < 0.0001) as shown in Fig. 3(b). This confirms that the spectral peak shifted from 0.5 MHz in controls towards 1.5 MHz in fibrotic mice systematically, providing evidence for fibrotic nodule formation. This fibrotic process involves both deposition of collagen and angiogenesis, as will be shown with histology.
3.3 Histopathological analysis of liver fibrosis
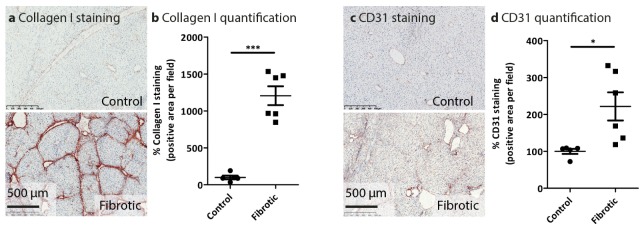
Exposure to CCl4 for 6 weeks resulted in increased accumulation of the major extracellular matrix protein with an increased degree of fibrosis as evidenced by increased collagen bridges in CCl4-treated mice as compared to healthy control mice (Fig. 4(a), 4(b)). Liver fibrosis induces progressive distortion of the intrahepatic vasculature and is accompanied by significant angiogenesis concurring due to portal hypertension. We therefore also evaluated angiogenesis using CD31 marker staining, and found that increased fibrosis was associated with enhanced angiogenesis as depicted in Fig. 4(c), 4(d).
Fig. 4.
Histological analysis of fibrotic parameters in control and CCl4-induced liver fibrosis mouse model. Representative photomicrographs of (a) Collagen I and (c) CD31 from healthy (control, n = 5), and 6 weeks (n = 6) CCl4-treated fibrotic mice. Quantitative histological analysis of (b) Collagen I and (d) CD31 immuno-histochemical stainings were performed in livers of the individual groups. Each symbol represents an individual mouse. Data represent mean ± SEM. *p<0.05, ***p<0.001 denotes statistical significance.
3.4 Correlation of photoacoustic quantification with histological fibrotic parameters
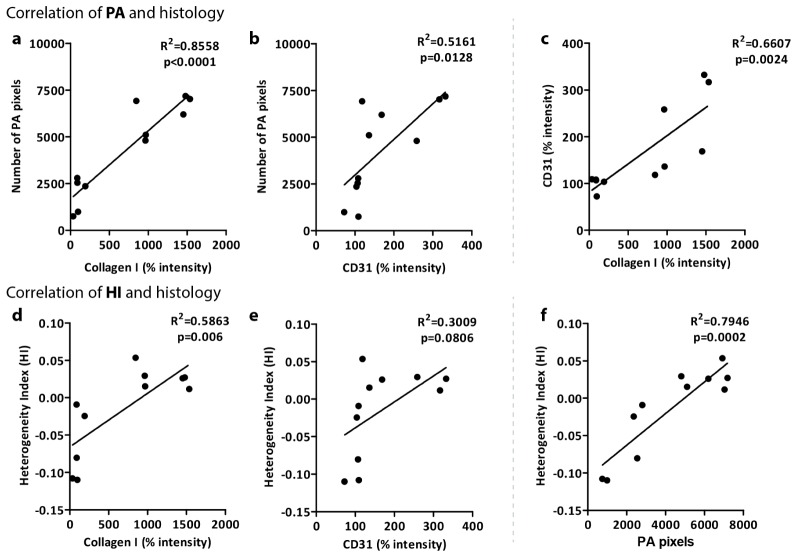
To further validate PA imaging, we performed a correlative analysis between photoacoustic imaging and the histological analyses i.e. collagen expression as a major fibrotic parameter. We found a significant correlation between the number of PA pixels in the liver ROI and collagen I intensity as shown in Fig. 5(a) (R2 = 0.8558, p<0.0001). Furthermore, modest correlation was observed between angiogenesis marker (CD31) and the number of PA pixels (Fig. 5(b)) (R2 = 0.5161, p = 0.0128). It should be noted that CD31 and collagen I both result from the same fibrotic process, and that they are therefore also significantly correlated (Fig. 5(c), R2 = 0.6607, p = 0.0024). These correlations suggest the existence of a significant link between PA imaging outcome and the fibrotic process.
Fig. 5.
Correlative analysis of number of photoacoustic pixels (PA) and heterogeneity index (HI) with histological parameters. Panels a and b depict correlations between PA pixels and % intensity of Collagen I and CD31 staining respectively. In addition, panel c shows the correlation between collagen I and CD31. Panels d and e show the correlation between the heterogeneity index (HI) and collagen I and CD31 staining respectively. Finally, panel f depicts the correlation between number of PA pixels and HI. Correlations were assessed using Pearson's correlative analysis. The dot plots for all the correlations were generated using the GraphPad Prism software. ‘R2’ denotes Pearson correlation coefficient and ‘p’ denotes statistical significance.
We also computed the correlations between the heterogeneity index (HI) and histological stainings to verify the significance of liver heterogeneity. Figures 5(d) and 5(e) show indeed this is the case: with R2 = 0.5863 and p = 0.006 for HI versus collagen I, and modest correlation between HI versus CD31 as R2 = 0.3009 and p = 0.0806. As expected, HI is furthermore significantly correlated with the number of PA pixels (Fig. 5(e)).
4. Discussion
In this study, we have demonstrated the applicability of the dual modality PA/US system in assessing the liver heterogeneity as caused by the experimental liver fibrosis. We have observed that, based on the PA frequency analysis, the increase in PA response in fibrotic livers due to the fibrotic nodules is linked to the sensitivity of the system to sub-millimeter structures. The fibrotic nodules are of a size of around 600 µm, whose PA signal would then fall within the detection bandwidth of the probe. Conversely, the liver without nodules acts as a single large absorber and – including the light penetration – would not provide a detectable PA response in its healthy state.
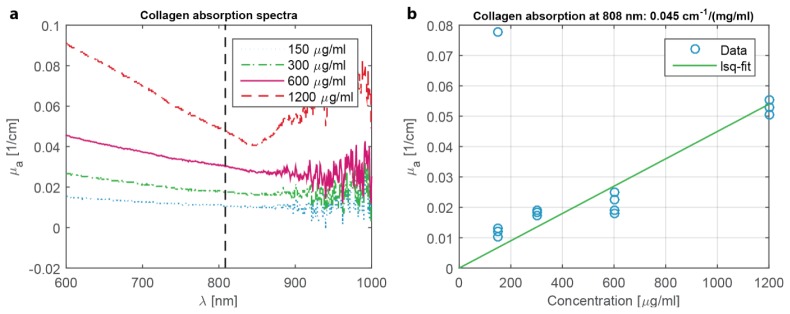
It should be noted, however, that the PA/US system is highly sensitive to the presence of nodules but not to its exact composition. While hemoglobin is a well-known absorber at 808 nm, our optical transmission measurements indicate that collagen I also absorbs significantly at this wavelength, especially when in large concentrations around the fibrotic nodules (see Appendix Fig. 6). These nodules may therefore act as a shell-like absorber. Unfortunately, the system cannot confirm this exact absorption structure, as the primary frequency response does not change whether a spherical absorber is homogeneous or shell-like in nature [25]. It is also unclear to what extent angiogenesis plays a role in the absorption of the nodules, as the corresponding staining appears to be less sensitive to fibrosis than collagen (Fig. 4(d)).
Fig. 6.
Absorption measurements for collagen I. (a) Absorption spectra measured using a Shimadzu UV-2501 spectrophotometer of collagen I / PBS solution in cuvettes. The concentrations were taken as per the average of collagen I concentration in typical fibrotic livers. (b) Plotting of the absorption at 808 nm for the range of concentrations shows proper linear behavior. Assuming 2% of the liver shows collagen scarring and that the total amount of collagen I is concentrated only in these scars, then the approximate absorption coefficient within scars is (0.025 / cm) / 2% = 5 / cm. This is of the same order as the absorption of hemoglobin in functioning blood vessels.
Some reserve should be placed on the relative amplitudes of the spectra in Fig. 3(a), as potential inaccuracies in the estimated PA impulse response, that is used to correct the spectra, may influence the amplitudes for 0.5-2 MHz. Nevertheless, the peak locations at 0.5 MHz and 1.5 MHz are expected to be quite accurate, as these spectra are the average over many PA responses from the liver, thereby lowering the potentially erroneous contributions from for instance unrelated blood vessels. For fibrotic mice, the spectral content for frequencies above 2 MHz is likely related to smaller fibrotic nodules in combination with harmonics of the larger nodules. They are present in quite varying degrees for the fibrotic livers, and are therefore assumed not to be a fundamental indicator of fibrosis.
It should also be noted that the light has to propagate further through tissue to reach the liver in case of the control mice as shown in Fig. 2(a) (about 1 mm extra). It could be possible that this would lower PA response compared to fibrotic livers. Note that this would only affect the number of PA pixels, not the heterogeneity index as spectral differences are normalized by their mean amplitude. The ultrasound attenuation in tissue, is on a larger length scale than optical attenuation making it highly unlikely to affect the PA frequency spectra and therefore the heterogeneity index. In addition, the skin’s PA response is also higher in case of the fibrotic mice. While no evidence of skin inflammation with CCl4 fibrosis models has been reported, this could nevertheless explain the enhanced response due to increased perfusion or angiogenesis. Alternatively, the enhancement can be explained by the modification of the livers’ optical properties during fibrogenesis: an increase in scattering relative to absorption would lead to more reflectance and therefore increase the fluence within the skin.
One drawback of the current system is its lack of optical wavelength tuning, a technique available to the large laboratory lasers commonly used in PAI, via an optical parametric oscillator (OPO). While an OPO adds to the cost and size of a laser system, it allows the interrogation of the optical absorption spectrum of tissue chromophores, for instance hemoglobin and collagen. Because both hemoglobin and collagen absorb the 808 nm light pulses from the diode laser, both are expected to contribute to the photoacoustic signal generation. To resolve these contributions, a multi-wavelength PA/US probe – based on multiple diode lasers with different optical wavelengths, housed within the probe – is under development. Such a system could then also be used to interrogate the oxygenation of vasculature in mouse livers, which may provide quantification of liver hypoxia for improved staging of liver fibrosis, since hypoxia is an effect of inflammation and fibrosis. In addition, targeted exogenous probes, labeled with PA contrast agents can further expand the range of diagnostic imaging techniques in liver fibrosis, and would allow research into targeted therapeutics. When finished, a multi-wavelength diode laser system would remove the need for an OPO, further reducing the cost and footprint of a multi-wavelength PA system.
PAI is also a promising modality for the assessment of fibrosis in liver biopsies. Liver biopsy has been considered as the “gold standard” for the diagnosis and staging of liver fibrosis [26]. However, liver biopsies, ex-vivo excised tissues or human liver slices undergo extensive pathological processing: fixation, slicing and staining’s for microscopic analysis. The process is highly time-consuming accompanied by distortion of the sample. PA imaging will provide fibrosis assessment of a sample non-invasively, imaging microscopic morphological features without the need for sample modification.
Altogether, we have shown that a single-wavelength PA frequency spectrum can be used to quantify the structural changes within the liver. US imaging was beneficial for selection of a relevant liver region of interest and must be regarded as an essential feature for PA imaging. Furthermore, PA/US imaging does not require exogenous contrast agents for assessing liver fibrosis as shown in this study.
Therefore, this study provides the important evidence for the feasibility of PA/US dual modality imaging as a non-invasive approach for the detection of liver fibrosis in mice. Furthermore, this device holds a great promise for real-time imaging, and longitudinal animal studies to investigate therapy responses and disease progression.
Author contributions
RB, PVB and JP conceived and designed the experiments. RB, PVB and KD performed the experiments. RB, PVB and KD analyzed the data. RB and PVB wrote the paper. WS, JP and KD interpreted the results and critically revised the manuscript.
Competing financial interests
The authors declare no competing financial interests.
Appendix.
This is the appendix.
Funding
The research leading to these results has received funding from the European Community's Seventh Framework Programme (FP7/2007-2013) under grant agreement n° 318067, and the Netherlands Organization for Health Research and Development (ZonMw, NWO, VENI grant 916.151.94).
References and links
- 1.Friedman S. L., “Mechanisms of hepatic fibrogenesis,” Gastroenterology 134(6), 1655–1669 (2008). 10.1053/j.gastro.2008.03.003 [DOI] [PMC free article] [PubMed] [Google Scholar]
- 2.Hernandez-Gea V., Friedman S. L., “Pathogenesis of liver fibrosis,” Annu. Rev. Pathol. 6(1), 425–456 (2011). 10.1146/annurev-pathol-011110-130246 [DOI] [PubMed] [Google Scholar]
- 3.Friedman S. L., “Hepatic fibrosis -- overview,” Toxicology 254(3), 120–129 (2008). 10.1016/j.tox.2008.06.013 [DOI] [PubMed] [Google Scholar]
- 4.Schuppan D., Afdhal N. H., “Liver cirrhosis,” Lancet 371(9615), 838–851 (2008). 10.1016/S0140-6736(08)60383-9 [DOI] [PMC free article] [PubMed] [Google Scholar]
- 5.Gottschalk S., Fehm T. F., Deán-Ben X. L., Razansky D., “Noninvasive real-time visualization of multiple cerebral hemodynamic parameters in whole mouse brains using five-dimensional optoacoustic tomography,” J. Cereb. Blood Flow Metab. 35(4), 531–535 (2015). 10.1038/jcbfm.2014.249 [DOI] [PMC free article] [PubMed] [Google Scholar]
- 6.Esenaliev R. O., Larina I. V., Larin K. V., Deyo D. J., Motamedi M., Prough D. S., “Optoacoustic technique for noninvasive monitoring of blood oxygenation: a feasibility study,” Appl. Opt. 41(22), 4722–4731 (2002). 10.1364/AO.41.004722 [DOI] [PubMed] [Google Scholar]
- 7.Siphanto R. I., Thumma K. K., Kolkman R. G. M., van Leeuwen T. G., de Mul F. F. M., van Neck J. W., van Adrichem L. N. A., Steenbergen W., “Serial noninvasive photoacoustic imaging of neovascularization in tumor angiogenesis,” Opt. Express 13(1), 89–95 (2005). 10.1364/OPEX.13.000089 [DOI] [PubMed] [Google Scholar]
- 8.Rich L. J., Seshadri M., “Photoacoustic monitoring of tumor and normal tissue response to radiation,” Sci. Rep. 6, 21237 (2016). 10.1038/srep21237 [DOI] [PMC free article] [PubMed] [Google Scholar]
- 9.Bohndiek S. E., Sasportas L. S., Machtaler S., Jokerst J. V., Hori S., Gambhir S. S., “Photoacoustic tomography detects early vessel regression and normalization during ovarian tumor response to the antiangiogenic therapy trebananib,” J. Nucl. Med. 56(12), 1942–1947 (2015). 10.2967/jnumed.115.160002 [DOI] [PMC free article] [PubMed] [Google Scholar]
- 10.Wang X., Pang Y., Ku G., Xie X., Stoica G., Wang L. V., “Noninvasive laser-induced photoacoustic tomography for structural and functional in vivo imaging of the brain,” Nat. Biotechnol. 21(7), 803–806 (2003). 10.1038/nbt839 [DOI] [PubMed] [Google Scholar]
- 11.Tang J., Coleman J. E., Dai X., Jiang H., “Wearable 3-D Photoacoustic Tomography for Functional Brain Imaging in Behaving Rats,” Sci. Rep. 6, 25470 (2016). 10.1038/srep25470 [DOI] [PMC free article] [PubMed] [Google Scholar]
- 12.Tsunoi Y., Sato S., Kawauchi S., Ashida H., Saitoh D., Terakawa M., “In vivo photoacoustic molecular imaging of the distribution of serum albumin in rat burned skin,” Burns 39(7), 1403–1408 (2013). 10.1016/j.burns.2013.03.007 [DOI] [PubMed] [Google Scholar]
- 13.Nam S. Y., Chung E., Suggs L. J., Emelianov S. Y., “Combined ultrasound and photoacoustic imaging to noninvasively assess burn injury and selectively monitor a regenerative tissue-engineered construct,” Tissue Eng. Part C Methods 21(6), 557–566 (2015). 10.1089/ten.tec.2014.0306 [DOI] [PMC free article] [PubMed] [Google Scholar]
- 14.Taruttis A., Morscher S., Burton N. C., Razansky D., Ntziachristos V., “Fast multispectral optoacoustic tomography (MSOT) for dynamic imaging of pharmacokinetics and biodistribution in multiple organs,” PLoS One 7(1), e30491 (2012). 10.1371/journal.pone.0030491 [DOI] [PMC free article] [PubMed] [Google Scholar]
- 15.Deán-Ben X. L., Ford S. J., Razansky D., “High-frame rate four dimensional optoacoustic tomography enables visualization of cardiovascular dynamics and mouse heart perfusion,” Sci. Rep. 5, 10133 (2015). [DOI] [PMC free article] [PubMed] [Google Scholar]
- 16.Chamberland D. L., Wang X., Roessler B. J., “Photoacoustic tomography of carrageenan-induced arthritis in a rat model,” J. Biomed. Opt. 13(1), 011005 (2008). 10.1117/1.2841028 [DOI] [PubMed] [Google Scholar]
- 17.Beziere N., von Schacky C., Kosanke Y., Kimm M., Nunes A., Licha K., Aichler M., Walch A., Rummeny E. J., Ntziachristos V., Meier R., “Optoacoustic imaging and staging of inflammation in a murine model of arthritis,” Arthritis Rheumatol. 66(8), 2071–2078 (2014). 10.1002/art.38642 [DOI] [PubMed] [Google Scholar]
- 18.Xu G., Meng Z. X., Lin J. D., Yuan J., Carson P. L., Joshi B., Wang X., “The functional pitch of an organ: quantification of tissue texture with photoacoustic spectrum analysis,” Radiology 271(1), 248–254 (2014). 10.1148/radiol.13130777 [DOI] [PMC free article] [PubMed] [Google Scholar]
- 19.Xu G., Meng Z. X., Lin J. D., Deng C. X., Carson P. L., Fowlkes J. B., Tao C., Liu X., Wang X., “High resolution Physio-chemical Tissue Analysis: Towards Non-invasive In Vivo Biopsy,” Sci. Rep. 6, 16937 (2016). 10.1038/srep16937 [DOI] [PMC free article] [PubMed] [Google Scholar]
- 20.Guo Z., Xu Z., Wang L. V., “Dependence of photoacoustic speckles on boundary roughness,” J. Biomed. Opt. 17(4), 046009 (2012). 10.1117/1.JBO.17.4.046009 [DOI] [PMC free article] [PubMed] [Google Scholar]
- 21.Daoudi K., van den Berg P. J., Rabot O., Kohl A., Tisserand S., Brands P., Steenbergen W., “Handheld probe integrating laser diode and ultrasound transducer array for ultrasound/photoacoustic dual modality imaging,” Opt. Express 22(21), 26365–26374 (2014). 10.1364/OE.22.026365 [DOI] [PubMed] [Google Scholar]
- 22.Jaeger M., Schüpbach S., Gertsch A., Kitz M., Frenz M., “Fourier reconstruction in optoacoustic imaging using truncated regularized inverse k-space interpolation,” Inverse Probl. 23(6), S51–S63 (2007). 10.1088/0266-5611/23/6/S05 [DOI] [Google Scholar]
- 23.Diebold G. J., Sun T., Khan M. I., “Photoacoustic monopole radiation in one, two, and three dimensions,” Phys. Rev. Lett. 67(24), 3384–3387 (1991). 10.1103/PhysRevLett.67.3384 [DOI] [PubMed] [Google Scholar]
- 24.Kolkman R. G., Brands P. J., Steenbergen W., van Leeuwen T. G., “Real-time in vivo photoacoustic and ultrasound imaging,” J. Biomed. Opt. 13(5), 050510 (2008). 10.1117/1.3005421 [DOI] [PubMed] [Google Scholar]
- 25.Strohm E. M., Gorelikov I., Matsuura N., Kolios M. C., “Modeling photoacoustic spectral features of micron-sized particles,” Phys. Med. Biol. 59(19), 5795–5810 (2014). 10.1088/0031-9155/59/19/5795 [DOI] [PubMed] [Google Scholar]
- 26.Rockey D. C., Caldwell S. H., Goodman Z. D., Nelson R. C., Smith A. D., American Association for the Study of Liver Diseases , “Liver biopsy,” Hepatology 49(3), 1017–1044 (2009). 10.1002/hep.22742 [DOI] [PubMed] [Google Scholar]


