Fig. 2.
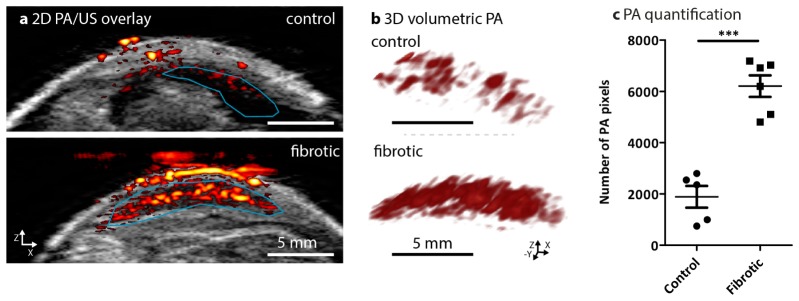
Non-invasive photoacoustic (PA) imaging and quantitation in control and CCl4-induced liver fibrosis mouse models. (a) Representative PA/US overlay scanned images of liver from healthy (control) mice (n = 5) and CCl4-treated fibrotic mice (n = 6). The confined blue lines denote the region of interest (ROI) registered during PA imaging and quantitation for the PA images. (b) Cross-view representation of the 3-dimensional volumetric reconstruction of PA imaging in the control livers and fibrotic mouse livers based on the ROI as shown in overlay images (see online Visualization 1 (397.9KB, MP4) and Visualization 2 (532.9KB, MP4) ). (c) The graph depicts the number of PA pixels (calculated in ROI within scanned livers, detailed in methods) in control livers and 6 weeks fibrotic livers. Each symbol represents an individual mouse. Data represent mean ± SEM. ***p<0.001 denotes statistical significance.

