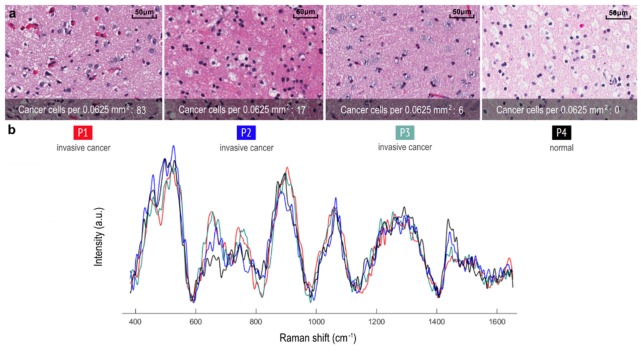
Fig. 6.
(a) Histopathology images for 4 tissue samples are shown: Three invasive grade 4 glioblastoma samples and one normal brain sample from a patient with a grade 2 astrocytoma, corresponding to locations where RS were made. (b) Raman spectra of the measurement locations in a, with visible spectral differences.

