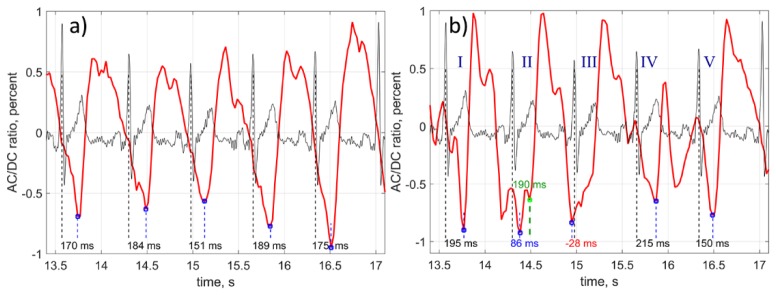
Fig. 4.
Illustration of the PPG waveform distortion by the stochastically enhanced notch. Fragment of the waveform without distortion (a), and with two notches appeared near the anacrotic wave (b). Black curves shows simultaneously recorded ECG. Both PPG waveforms were calculated from the ROIs spaced by 4.2 mm. Small blue squares show position of the found minima. Green square in the cardiac cycle II shows the position of the second local minimum defined by our algorithm.

