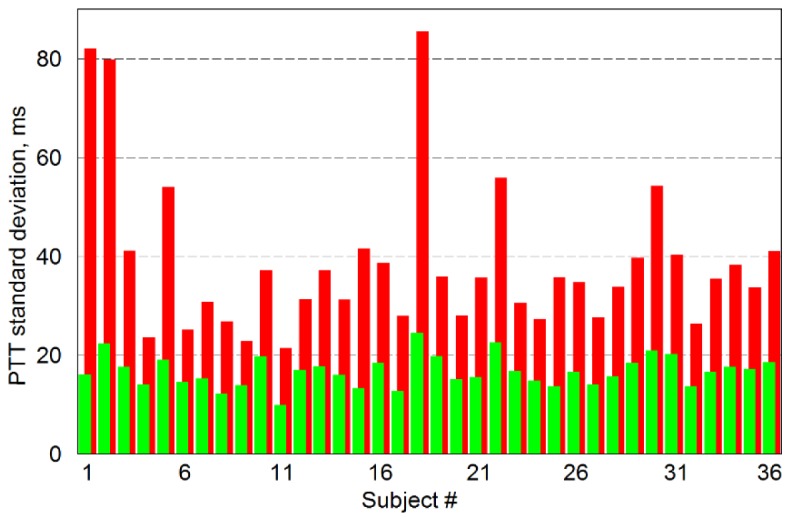
Fig. 5.

Standard deviation from the mean PTT calculated for all studied subjects. Red bars show mean STD calculated for all reliable ROI in the case of direct application of the minimal-value method when all cardiac cycles were taken into account. Green bars are STD calculated by new algorithm, which is finding PPG minima associated with the beginning of anacrotic wave in cardiac cycles distorted by dicrotic notch.
