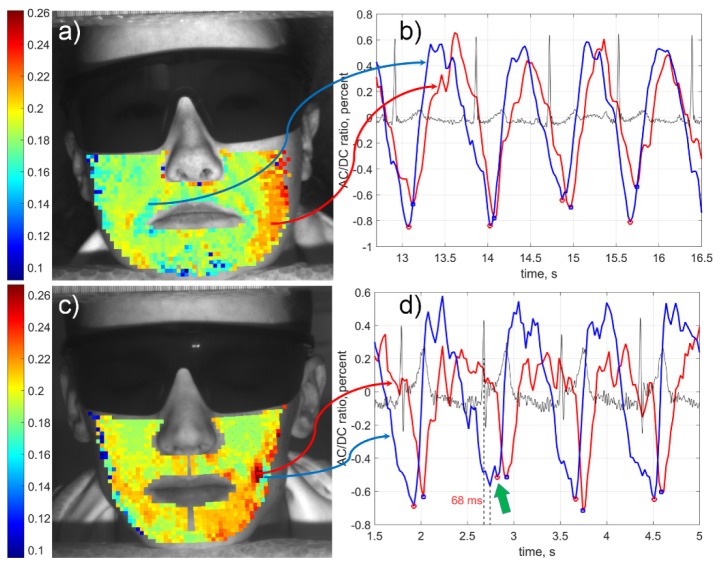
Fig. 6.
PTT mapping in the facial area of two subjects (a, c) and fragments of PPG waveforms (b, d) calculated in the ROIs situated in the regions with faster (blue) and slower (red) transit time, respectively. Black curves in the graphs (b, d) are ECG simultaneously recorded with videos. The color scales on the left show PTT in seconds. Green arrow in the graph (d) points the position of the PPG minimum defined by our algorithm in the distorted cardiac cycle. The ratio of the reliable/selected ROIs was 1113/1160 and 899/900 for subjects shown in panels (a) and (c), respectively.

