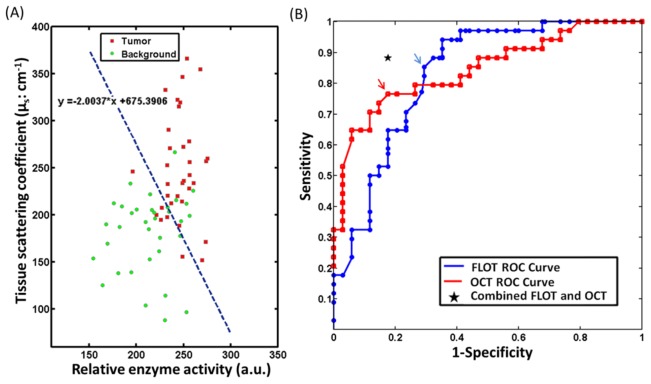
Fig. 7.
(A) LDA for classification of tumor tissue and normal tissue near tumor;(B) ROC curves for using tissue scattering coefficient only, relative enzyme activity only, and combined criteria. The arrows indicated the optimal threshold for OCT and FLOT. Combined criterion gives the optimal diagnosis (i.e., the closest distance to ideal diagnosis 100% (100%)).

