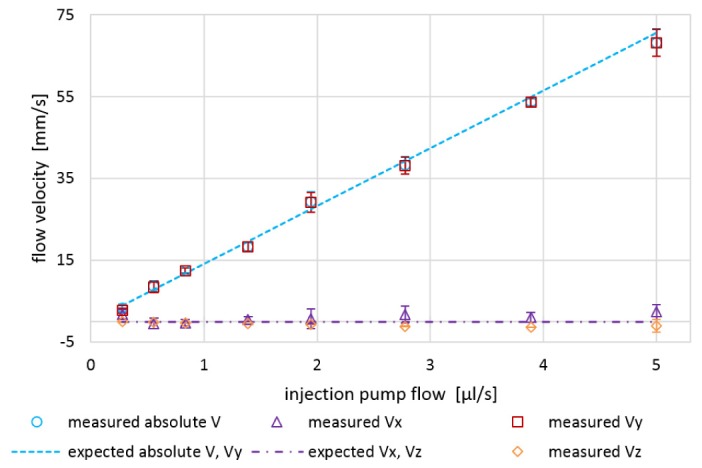
Fig. 7.

Quantitative in vitro flow phantom measurement results: Expected vs. measured velocity vector components Vx, Vy, Vz and |V| for varying pump flows (0.27–5.00 μl/s) at fixed angles δ = 90° and ρ = 90° (10-times averaged). Error bars indicate ± one standard deviation.
