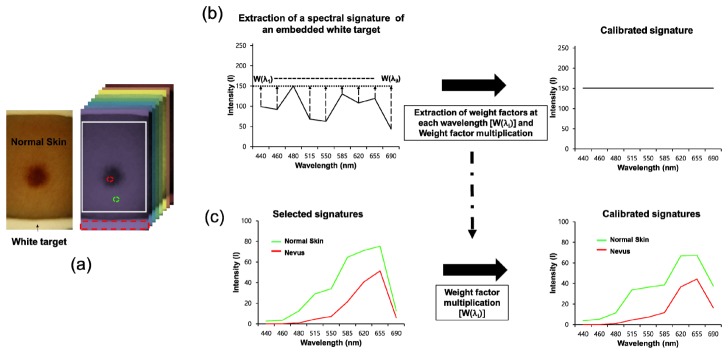
Fig. 6.
Calibration of spectral signatures at every pixel: (a) Photographic image of skin regions obtained using our system and an image cube. The arrow indicates the embedded white target in the image. The red-dotted rectangular represents the area selected for calculation of the mean intensity of the embedded white target. The red- and green-dotted circles indicate the regions selected to obtain the spectral signatures of normal skin and nevus regions. (b) Extraction of weight factors at different wavelengths from the embedded white target. w(λi): weight factor at the ith wavelength (λ) (c) Calibration of a selected spectral signature. Intensity of the selected spectral signature at each wavelength was multiplied by the weight factor at the identical wavelength.

