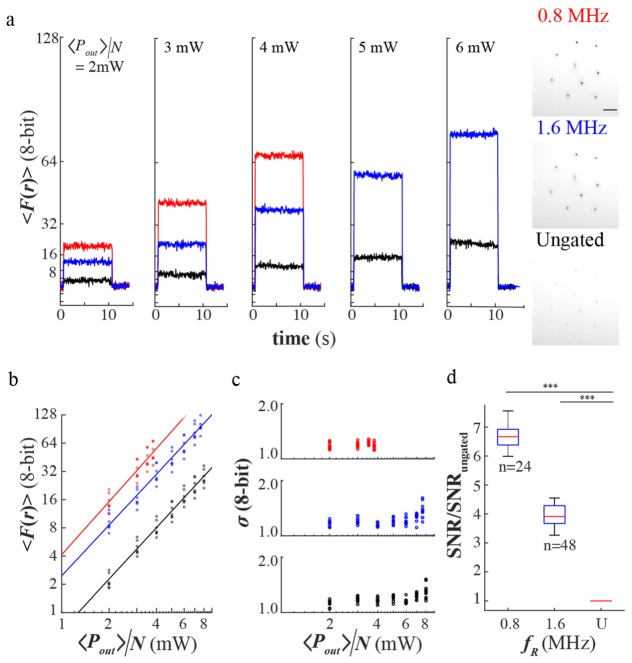
Fig. 2.
(a) Sample time-series across <Pout>/N ~2 to 6mW for ungated and temporally gated beam and sample negative images of the fluorescence from the holographic sites at <P>/N = 4mW, (b) The plot of fluorescence of each site with power, (c) The fluctuations of the fluorescence with power (d) The pooled SNR of each site for gated beam (fR = 0.8 and 1.6 MHz) relative to the SNR of the ungated beam (U).

