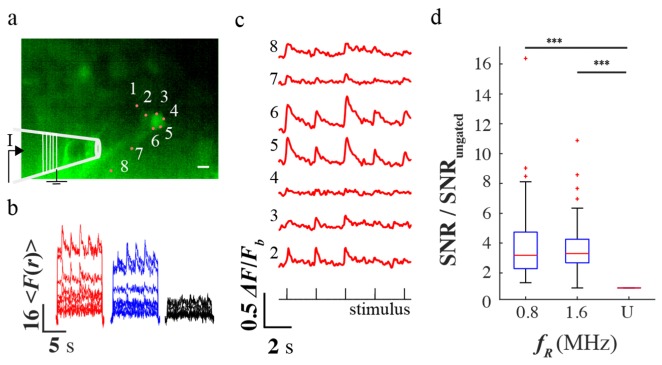
Fig. 3.
(a) Epifluorescence image of the neuronal cultures loaded with Cal-520 dye with the positions of the eight holographically projected two-photon sites. (b) A sample time-series plot of the fluorescence of each site for ungated and temporally gated beam at 4mW average power (c) The relative change in the fluorescence under 0.8 MHz and 4 mW temporally gated beam (d) The pooled SNR ratio of the temporally gated beam relative to the ungated beam. The scale bar is 50µm.

