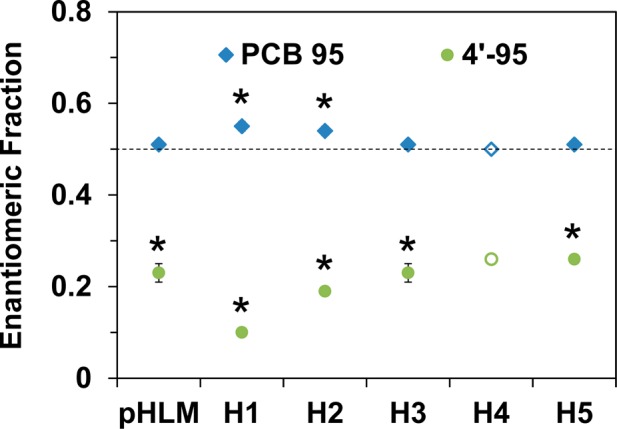
Figure 2.

Metabolism of racemic PCB 95 in incubations with different HLMs results in the atropselective formation of E2-4′-95 and for HLMs from donors H1 and H2, a depletion of E2-PCB 95. Incubations were performed for 120 min; Table S6). The dotted line indicates the EF value of the racemic standards. Data are the mean ± standard deviation. Open symbols indicate n = 1. *Significantly different from the racemic standard (p < 0.05).
