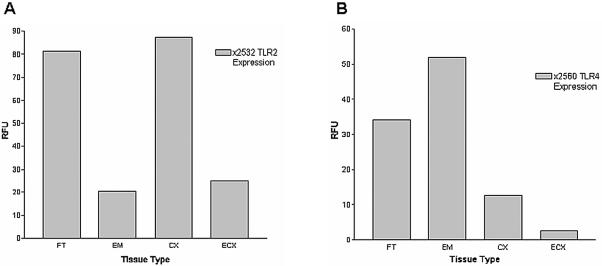
FIG. 5.
Representative analysis of TLR2 and TLR4 expression profiles. (A) Total RNA was extracted from fallopian tube (FT), endometrium (EM), cervix (CX), and ectocervix (ECX) samples of patient 2532 and reverse transcribed with random hexamers. TLR2 levels were quantified by real-time analysis with Taqman TLR2 primers and probes as in Fig. 3. (B) TLR4 mRNA levels were quantified in fallopian tube (FT), endometrium (EM), cervix (CX), and ectocervix (ECX) samples derived from patient 2560 by real-time Taqman PCR as described for Fig. 4. Reactions were standardized against β-actin and are expressed in relative fluorescence units (RFU). Values shown are the means of duplicate PCR runs, which never varied by more than 3%.

